Fig. 6.
Download original image
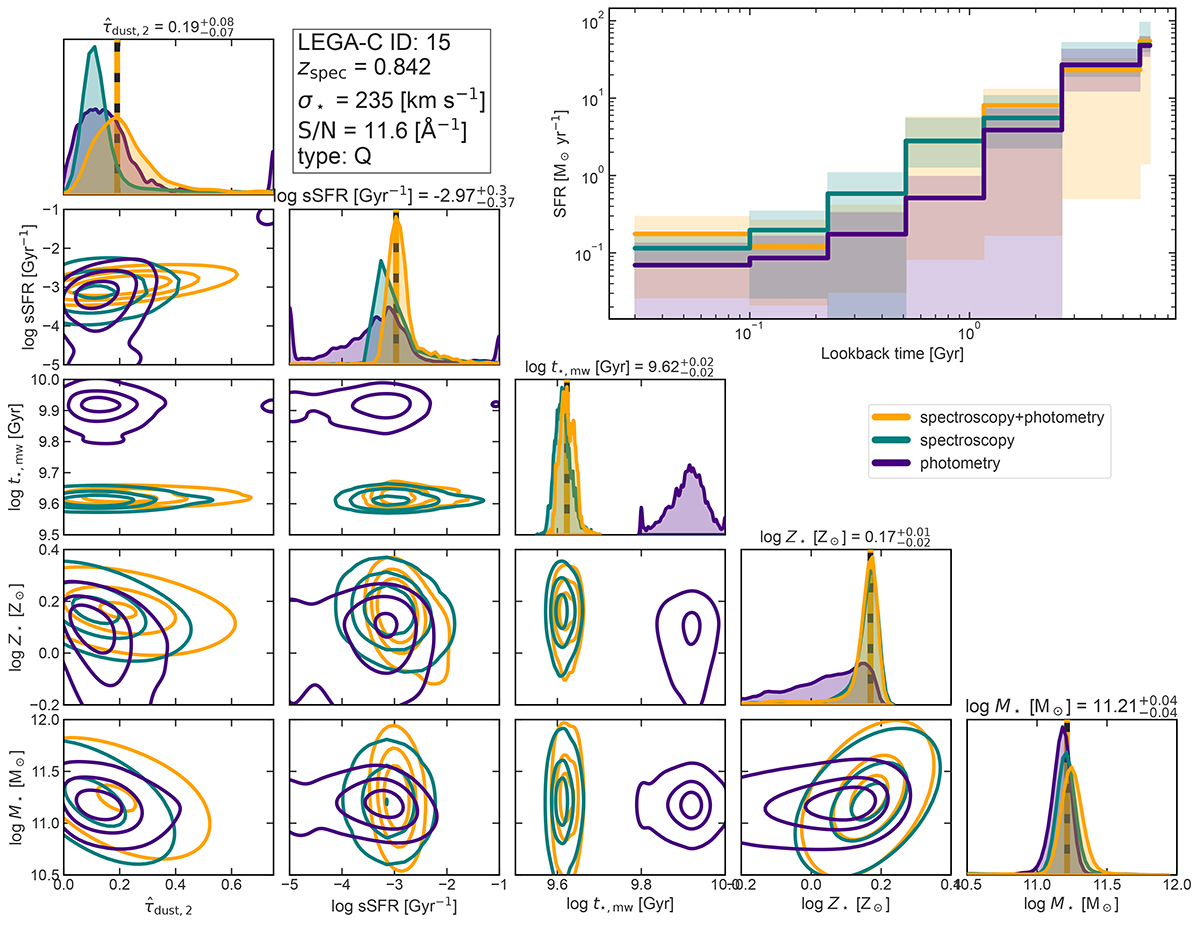
Joint posterior distributions of various physical quantities and SFHs retrieved from three different SED fitting runs, for an example quiescent galaxy at zspec = 0.842. In the cornerplot, we present the posterior distributions of ![]() , sSFR, t⋆, mw, Z⋆, and M⋆. We compare the posterior distributions of our fiducial run (spectroscopy+photometry, orange) with those from the spectroscopy-only (teal) and photometry-only (purple) run. The contours enclose 20%, 50% and 80% of the total data, of each fitting run. The vertical black dashed line indicates the best-fit value of each physical quantity from our fiducial run. The inset in the right corner of the figure contains the SFH posteriors for each fitting run.
, sSFR, t⋆, mw, Z⋆, and M⋆. We compare the posterior distributions of our fiducial run (spectroscopy+photometry, orange) with those from the spectroscopy-only (teal) and photometry-only (purple) run. The contours enclose 20%, 50% and 80% of the total data, of each fitting run. The vertical black dashed line indicates the best-fit value of each physical quantity from our fiducial run. The inset in the right corner of the figure contains the SFH posteriors for each fitting run.
Current usage metrics show cumulative count of Article Views (full-text article views including HTML views, PDF and ePub downloads, according to the available data) and Abstracts Views on Vision4Press platform.
Data correspond to usage on the plateform after 2015. The current usage metrics is available 48-96 hours after online publication and is updated daily on week days.
Initial download of the metrics may take a while.