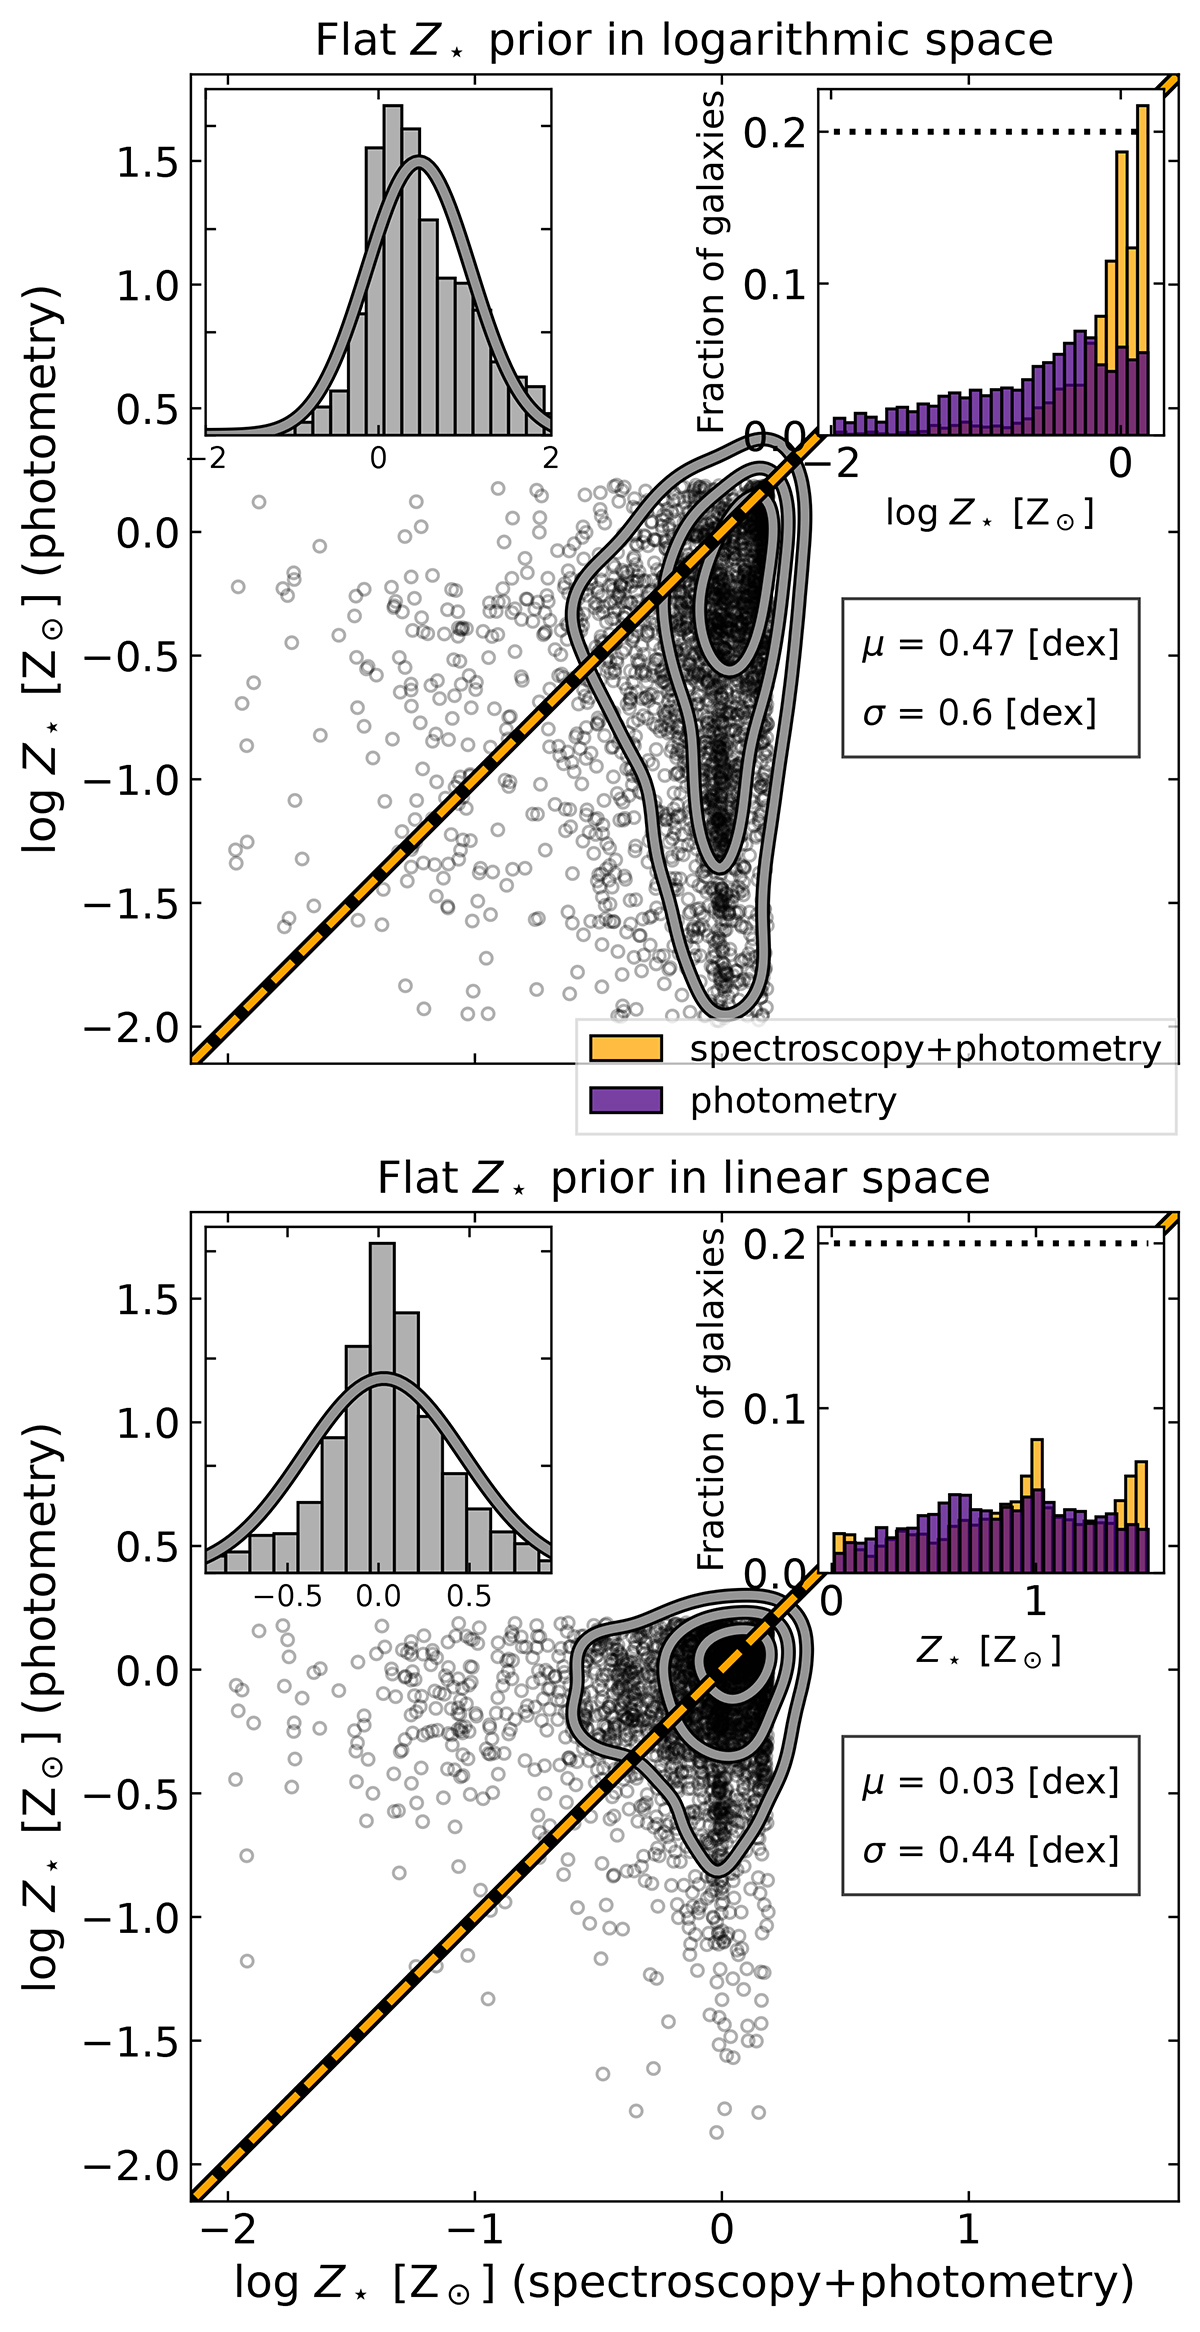
Fig. 5.
Download original image
Comparison of stellar metallicities using different prior functions. The stellar metallicities obtained from spectrophotometric modeling (x-axis) are compared with those derived from photometry-only fits (y-axis), using a flat prior for Z⋆ in logarithmic space (top panel) and linear space (bottom panel). The dashed orange line represents the one-to-one relationship, while the contours enclose 20%, 50% and 80% of the total data. The inset in the top-left corner shows the residual distribution, log(Z⋆, spec + phot/Z⋆, phot). Meanwhile, the inset in the top-right corner compares the fiducial Z⋆ from spectrophotometric modeling (orange distribution) with the photometry-only results (purple distribution). The dotted lines correspond to the prior probability distributions, scaled by an arbitrary factor for clarity. The mean offset and scatter between the two distributions are reported in each panel.
Current usage metrics show cumulative count of Article Views (full-text article views including HTML views, PDF and ePub downloads, according to the available data) and Abstracts Views on Vision4Press platform.
Data correspond to usage on the plateform after 2015. The current usage metrics is available 48-96 hours after online publication and is updated daily on week days.
Initial download of the metrics may take a while.