Fig. 13.
Download original image
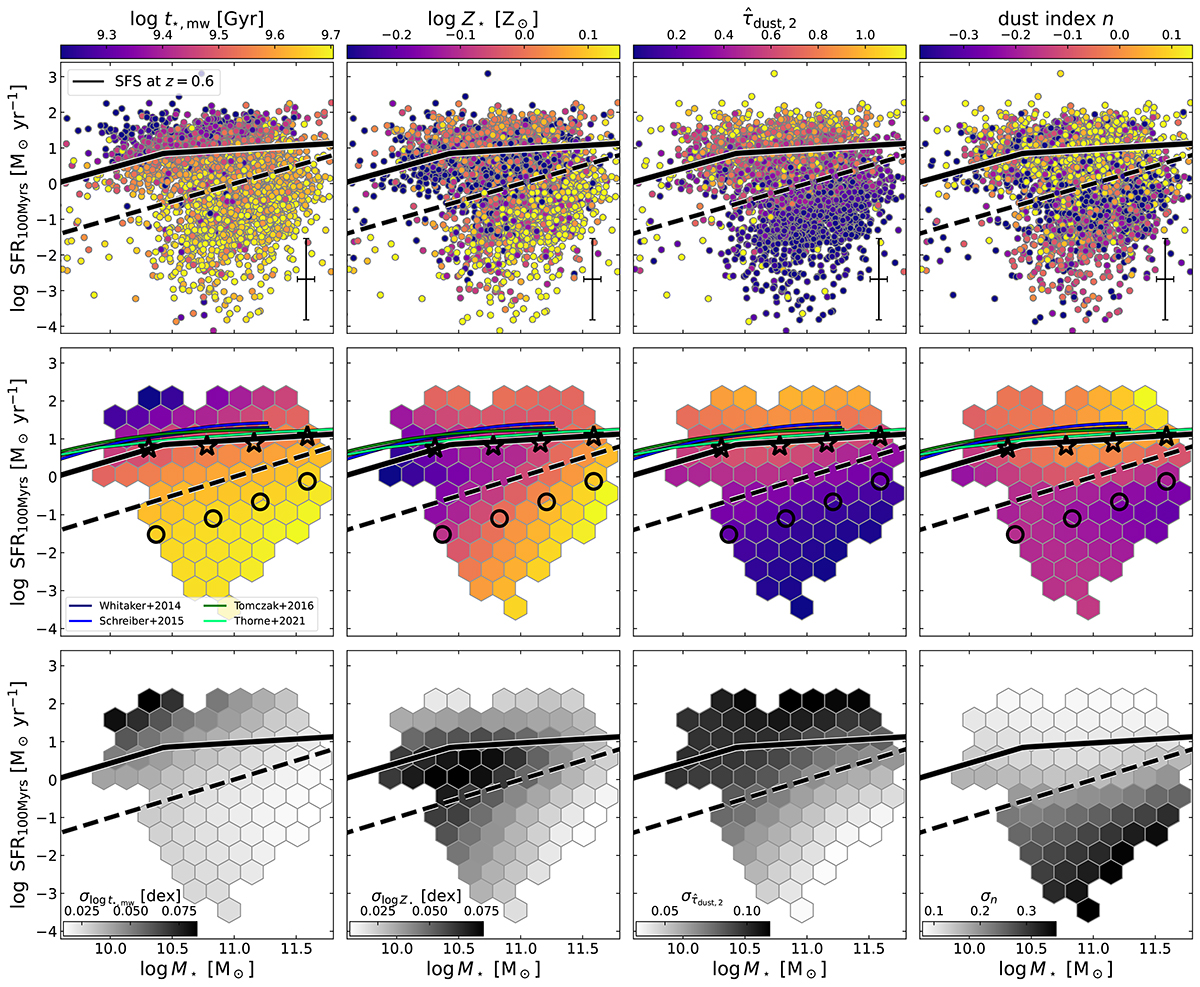
Mean stellar population and dust properties in the SFR100 Myrs–M⋆ plane of our primary sample. Panels from left to right display: mass-weighted stellar age (t⋆, mw), stellar metallicity (Z⋆), dust optical depth in the V band (![]() ), and dust attenuation slope index (n). Top row: Individual data points, with typical error bars shown in the bottom-right corner of each panel. Middle row: Average trends of the physical properties across the SFR100 Myrs–M⋆ plane, derived using the LOESS method. Bottom row: Average upper uncertainties for each property. Each hexbin includes a minimum of five galaxies. The SFS at z = 0.60 is indicated by the solid black line, following the definition of Leja et al. (2022), while the dashed black line represents the boundary between star-forming and quiescent galaxies (sSFR = 10−11 yr−1). In the middle row, black markers indicate the median SFR100 Myrs values in bins of M⋆: open stars for star-forming galaxies and open circles for quiescent galaxies (see Table 2). Additionally, results from previous studies at a similar redshift range are overplotted for comparison.
), and dust attenuation slope index (n). Top row: Individual data points, with typical error bars shown in the bottom-right corner of each panel. Middle row: Average trends of the physical properties across the SFR100 Myrs–M⋆ plane, derived using the LOESS method. Bottom row: Average upper uncertainties for each property. Each hexbin includes a minimum of five galaxies. The SFS at z = 0.60 is indicated by the solid black line, following the definition of Leja et al. (2022), while the dashed black line represents the boundary between star-forming and quiescent galaxies (sSFR = 10−11 yr−1). In the middle row, black markers indicate the median SFR100 Myrs values in bins of M⋆: open stars for star-forming galaxies and open circles for quiescent galaxies (see Table 2). Additionally, results from previous studies at a similar redshift range are overplotted for comparison.
Current usage metrics show cumulative count of Article Views (full-text article views including HTML views, PDF and ePub downloads, according to the available data) and Abstracts Views on Vision4Press platform.
Data correspond to usage on the plateform after 2015. The current usage metrics is available 48-96 hours after online publication and is updated daily on week days.
Initial download of the metrics may take a while.