Fig. 5
Download original image
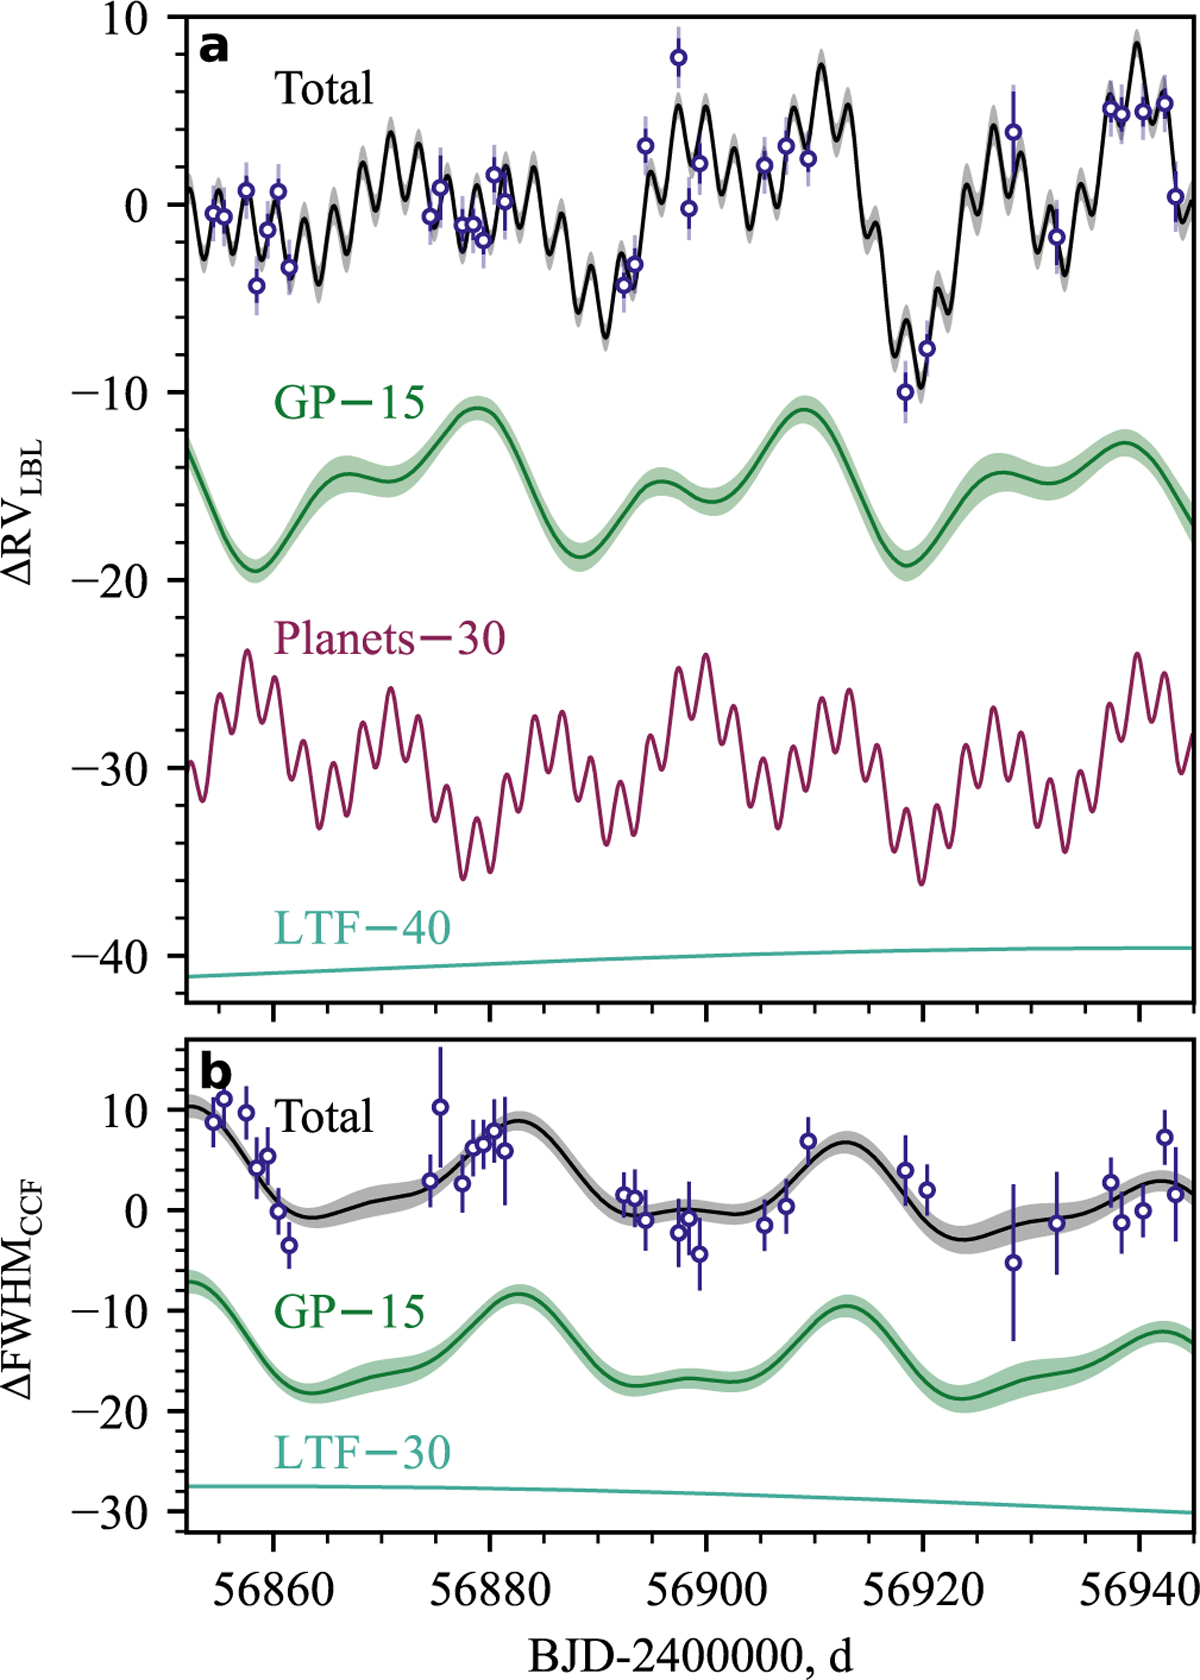
Raw time series (blue points) against our best model (d4; solid lines) in a selected temporal region. Data points come with two error bars: one assigned by the instrument (blue), and another that includes the model jitter (grey; Sect. 3.1). (a) LBL RV in m s−1, where the full model (black) is split into the stellar-activity GP component (green), the three-planet component (red) and the LTF (teal). (b) CCF FWHM in m s−1, where the full model (black) is split into the stellar-activity GP component (green) and the LTF (teal). Every component is offset by an arbitrary amount, labelled in the plots. The 1σ confidence intervals of the GP are given in shaded bands.
Current usage metrics show cumulative count of Article Views (full-text article views including HTML views, PDF and ePub downloads, according to the available data) and Abstracts Views on Vision4Press platform.
Data correspond to usage on the plateform after 2015. The current usage metrics is available 48-96 hours after online publication and is updated daily on week days.
Initial download of the metrics may take a while.