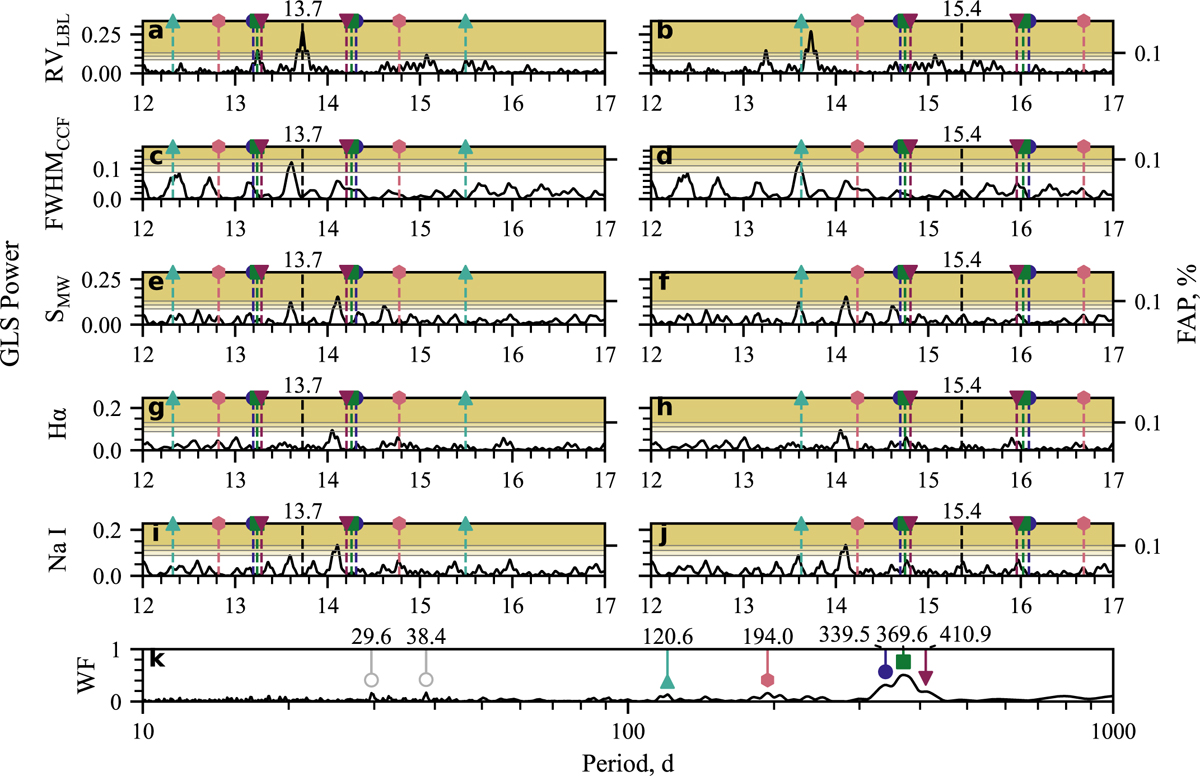
Fig. B.2
Download original image
Alias analysis of long-term detrended signals near 13.7 d in: (a,b) LBL RV, (c,d) CCF FWHM, (e,f) S-index, (g,h) Hα, (i,j) Na I. The left column shows aliases of the 13.7 d signal, found in RV and attributed to GJ 3998 c. The right column shows aliases of half the Prot peak found in the raw-data GLSP, at 15.4 d. (k) The WF reveals five prominent peaks at: 120.6 d (upward teal triangle), 194.0 d (pink hexagon), 339.5 d (blue circle), 369.6 d (green square) and 410.9 d (downward red triangle). Relevant aliases in data periodograms are plotted with dashed lines of a corresponding colour and marker. There are other strong peaks in the WF that do not create aliases in the specified period range (hollow grey circles).
Current usage metrics show cumulative count of Article Views (full-text article views including HTML views, PDF and ePub downloads, according to the available data) and Abstracts Views on Vision4Press platform.
Data correspond to usage on the plateform after 2015. The current usage metrics is available 48-96 hours after online publication and is updated daily on week days.
Initial download of the metrics may take a while.