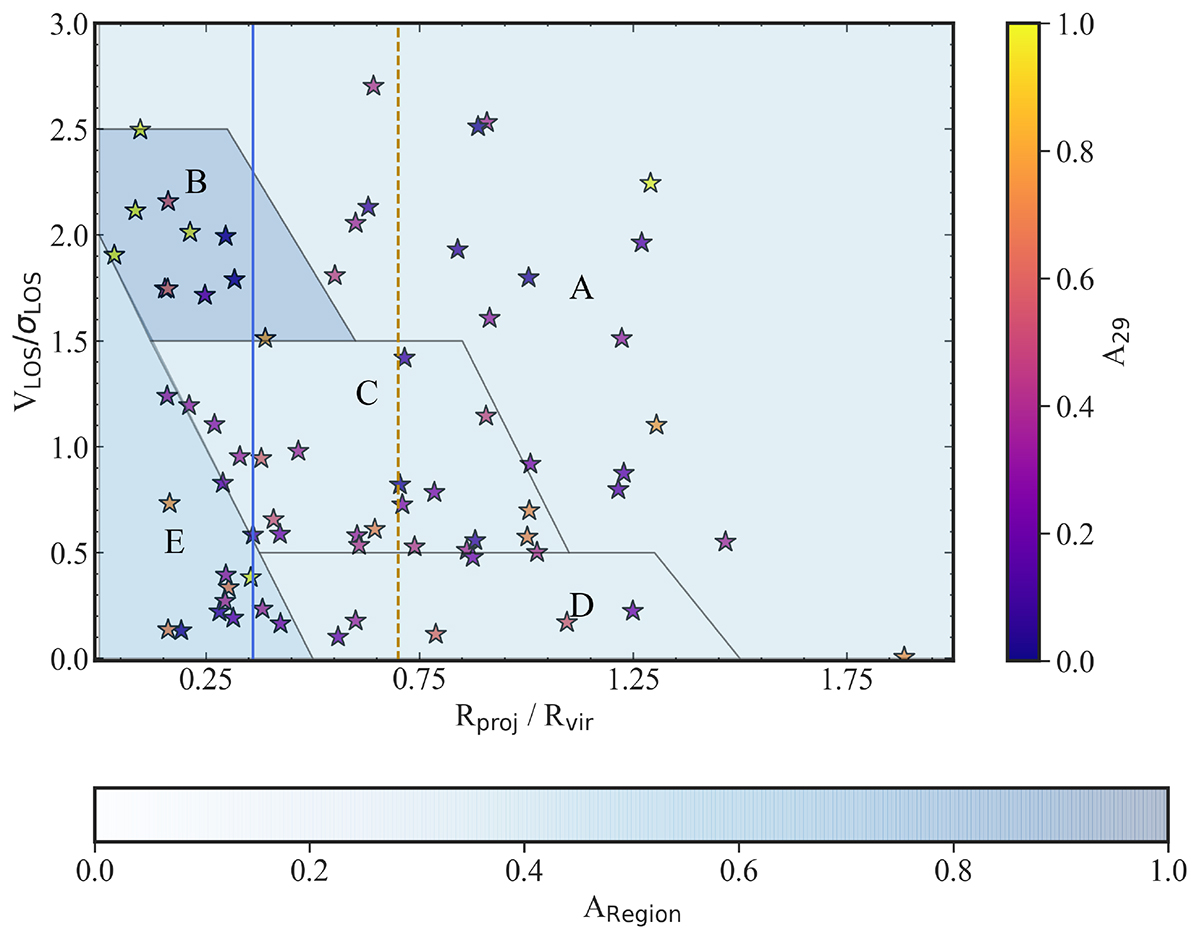
Fig. 7.
Download original image
Distribution of Fornax dEs in PPS. The diagram is divided into five regions following the Rhee et al. (2017) classification scheme to show the different phases of galaxy infall into the cluster. The colour bar shows the asymmetry value for dwarf galaxies. The colours indicate the mean asymmetry value for galaxies within each respective region.
Current usage metrics show cumulative count of Article Views (full-text article views including HTML views, PDF and ePub downloads, according to the available data) and Abstracts Views on Vision4Press platform.
Data correspond to usage on the plateform after 2015. The current usage metrics is available 48-96 hours after online publication and is updated daily on week days.
Initial download of the metrics may take a while.