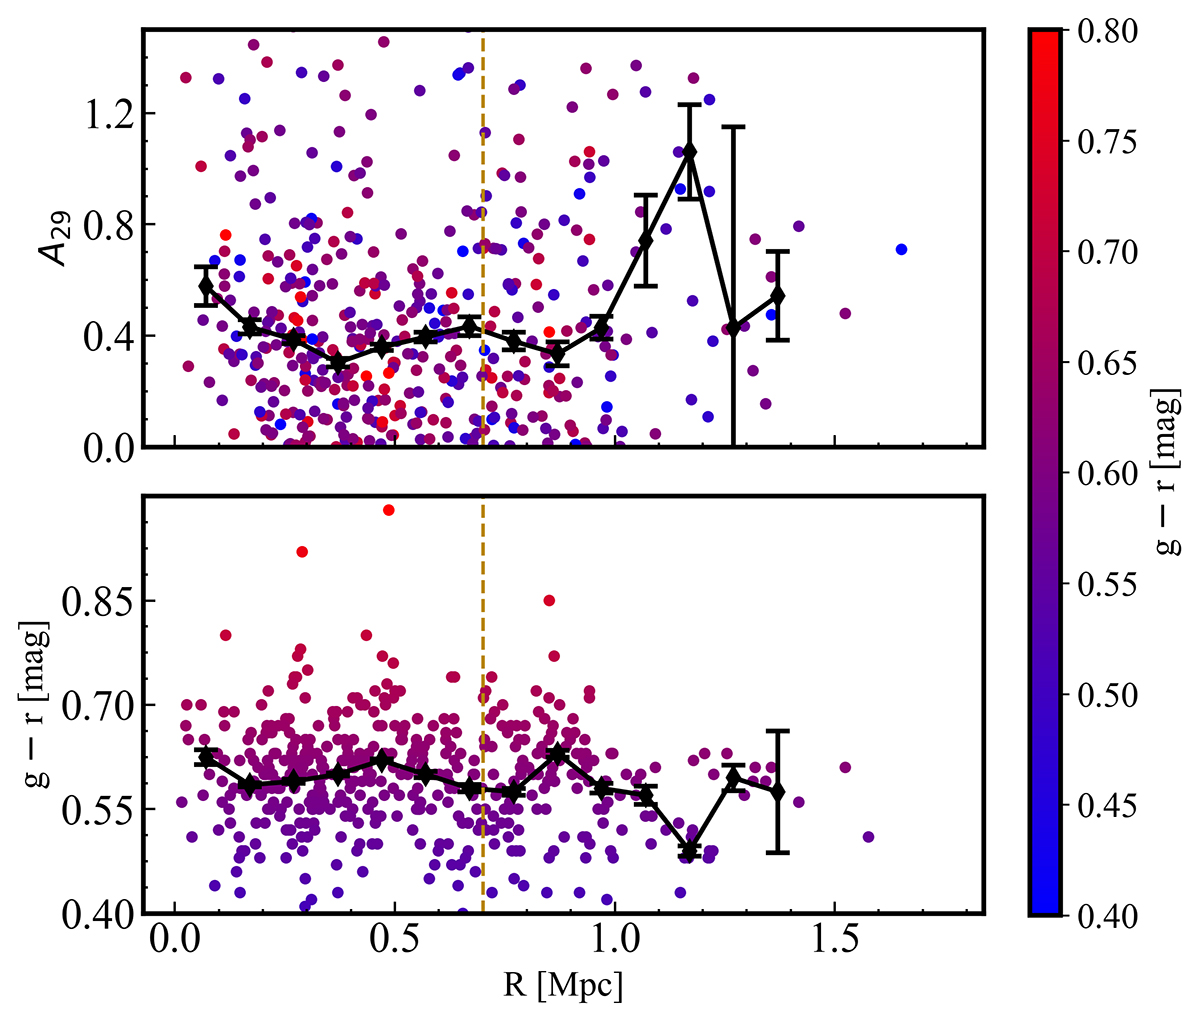
Fig. 2.
Download original image
Dependence of parameter A on the projected cluster-centric radius, R (upper panel) and the variation in colour with R (lower panel). The black dots represent the median values of the measurements in each bin, with the error bars indicating the bootstrapped 95% confidence interval. The colour bar corresponds to the g − r colour. The dashed yellow line at 0.7 Mpc indicates the virial radius.
Current usage metrics show cumulative count of Article Views (full-text article views including HTML views, PDF and ePub downloads, according to the available data) and Abstracts Views on Vision4Press platform.
Data correspond to usage on the plateform after 2015. The current usage metrics is available 48-96 hours after online publication and is updated daily on week days.
Initial download of the metrics may take a while.