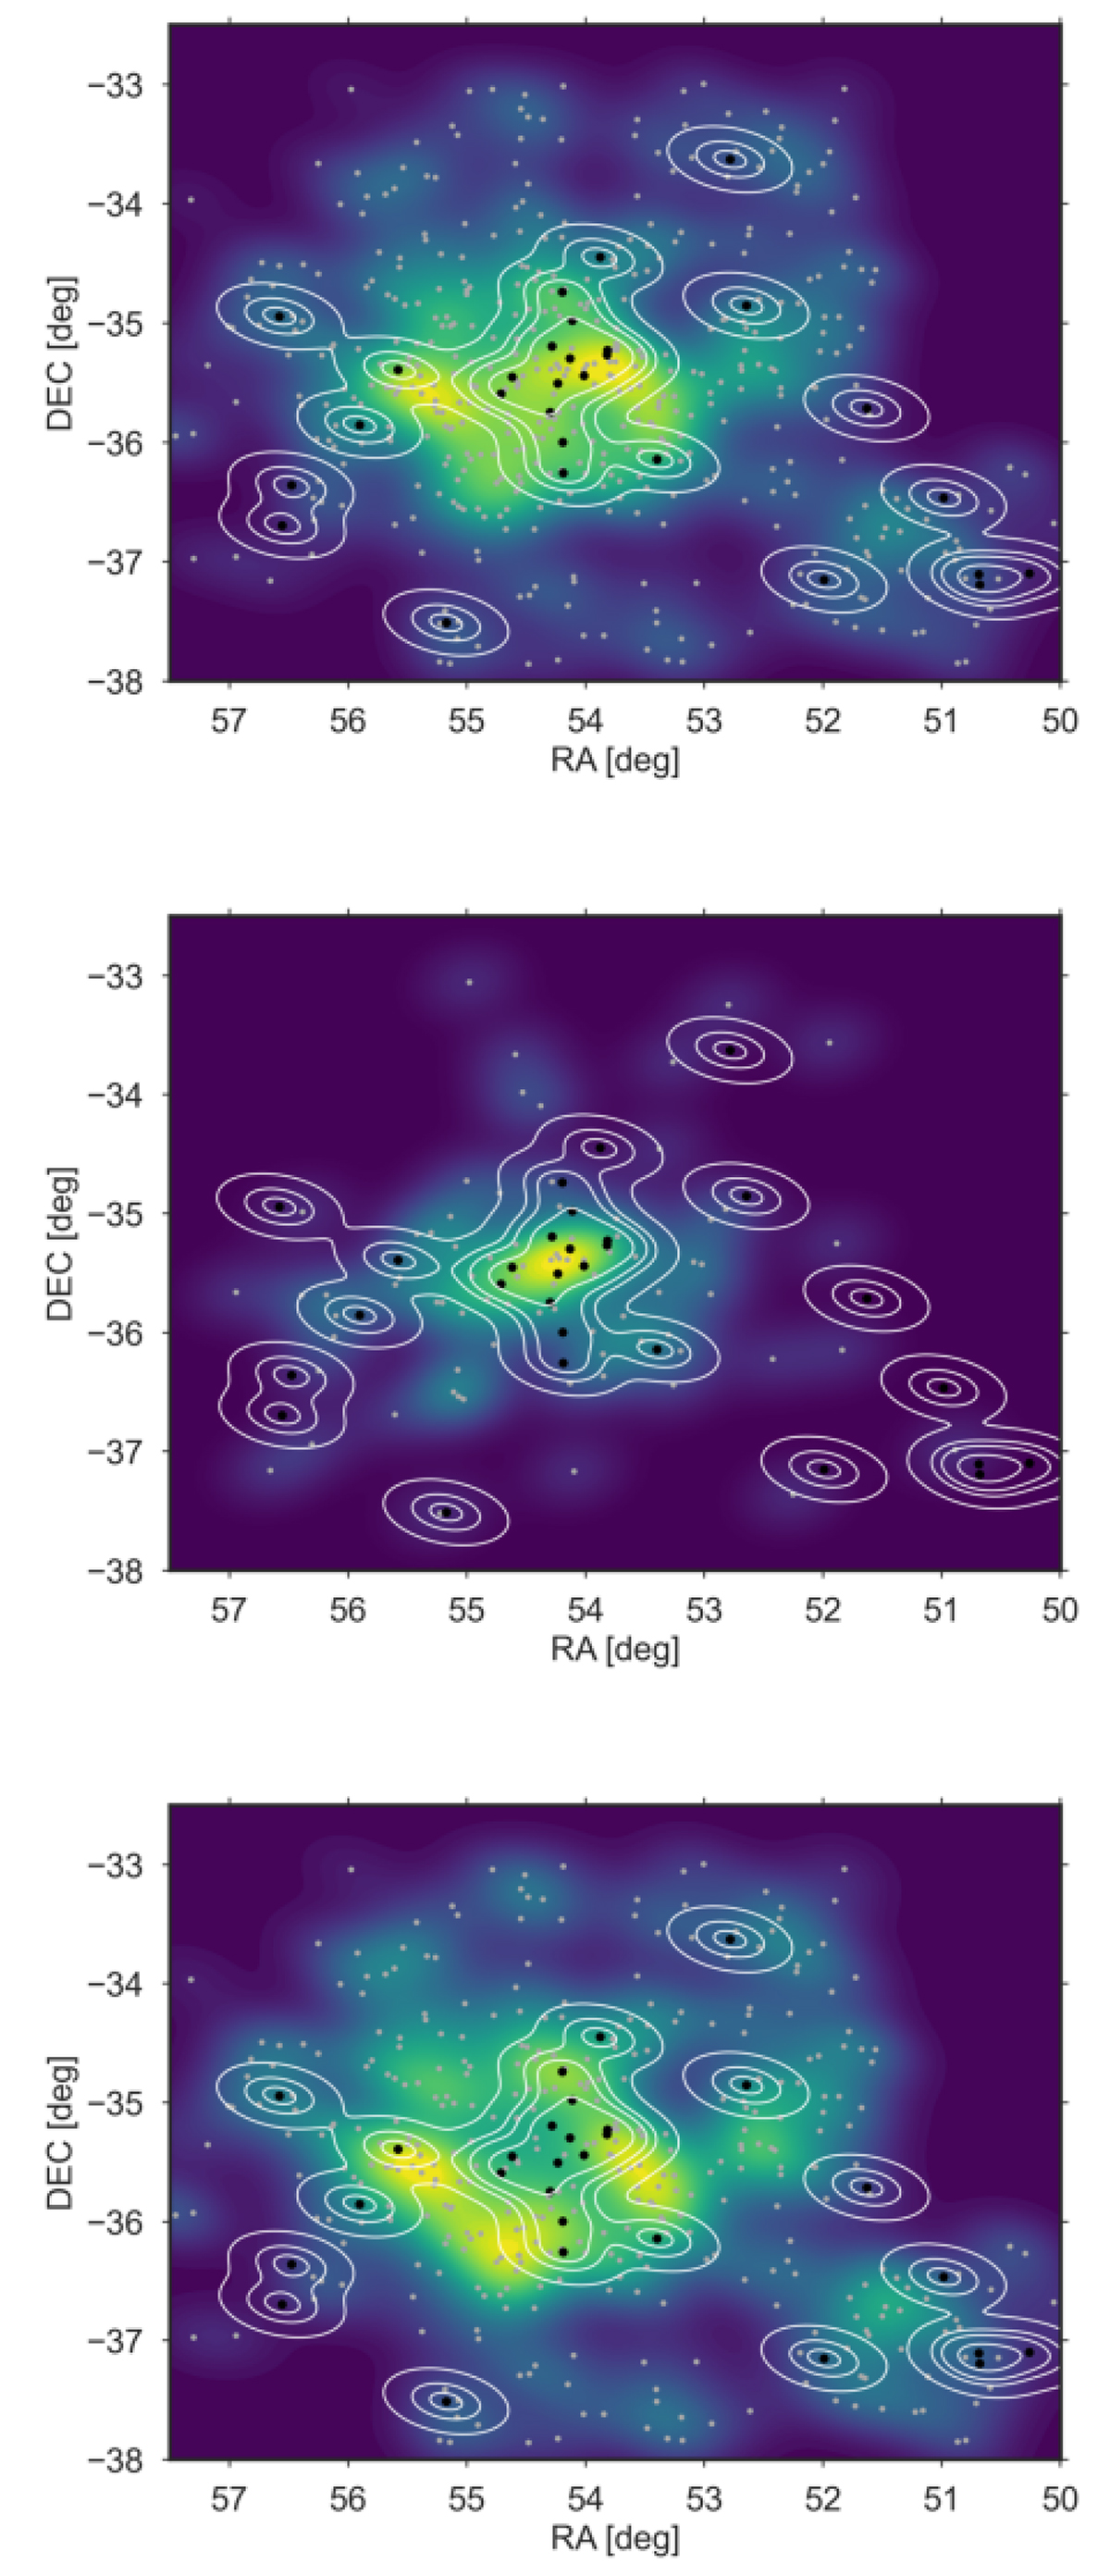
Fig. 10.
Download original image
Distribution of dE galaxies in the Fornax cluster shown as surface number density maps. The figure shows the distributions of all dEs (top panel), nucleated dEs (middle panel), and non-nucleated dEs (bottom panel). The white contours represent isodensity levels derived from the kernel density estimate for massive galaxies, while the black dots indicate their specific positions. Grey dots mark the positions of dwarf galaxies.
Current usage metrics show cumulative count of Article Views (full-text article views including HTML views, PDF and ePub downloads, according to the available data) and Abstracts Views on Vision4Press platform.
Data correspond to usage on the plateform after 2015. The current usage metrics is available 48-96 hours after online publication and is updated daily on week days.
Initial download of the metrics may take a while.