Fig. 2
Download original image
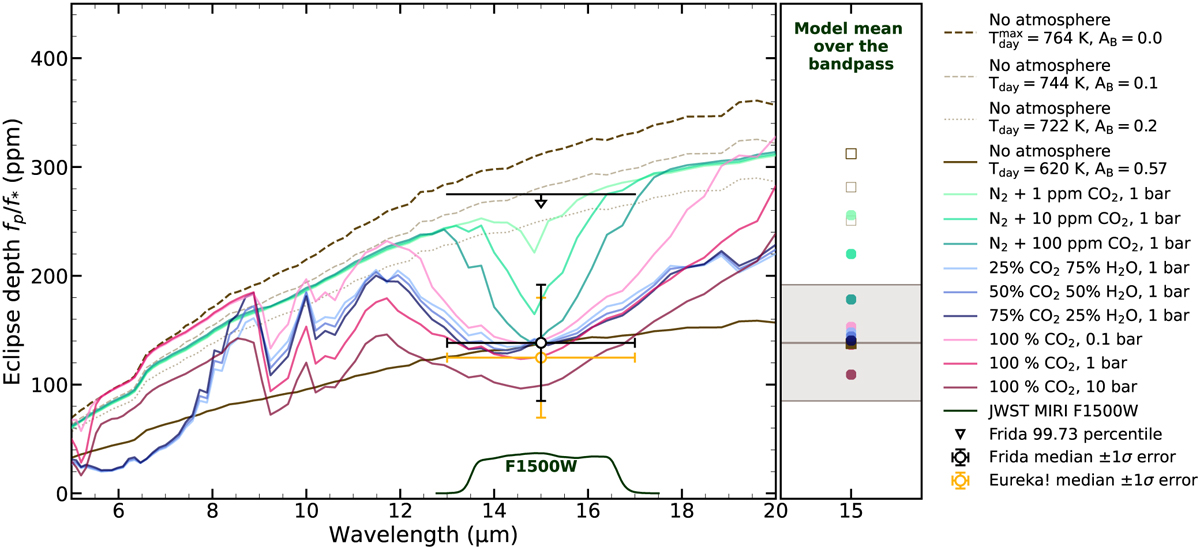
Left panel: JWST/MIRI photometry eclipse depth measurement at 15 µm (black data point) in context with different atmospheric models (solid coloured lines), and airless blackbody (BB) models for different Bond albedos (AB; dashed and dotted brown lines). We note that Tday is the corresponding dayside brightness temperature as computed with Equation (2). All atmospheric scenarios are computed with AB = 0.1 and using the ‘f-approximation formula’ based on Koll (2022). N2 and O2 are both spectrally inactive (no significant absorption features) at these wavelengths, thus yielding nearly identical thermal emission spectra. Only the N2/CO2 scenarios are plotted for simplicity. The result from the Eureka! reduction is also shown (orange data point). Right panel: atmospheric models (coloured circles) and atmosphere-less models (squares) from the left panel averaged over the F1500W bandpass. The grey shaded region represents the lower and upper error on the photometric measurement (solid line) obtained through a simple mean of both pipeline results.
Current usage metrics show cumulative count of Article Views (full-text article views including HTML views, PDF and ePub downloads, according to the available data) and Abstracts Views on Vision4Press platform.
Data correspond to usage on the plateform after 2015. The current usage metrics is available 48-96 hours after online publication and is updated daily on week days.
Initial download of the metrics may take a while.