Fig. 1
Download original image
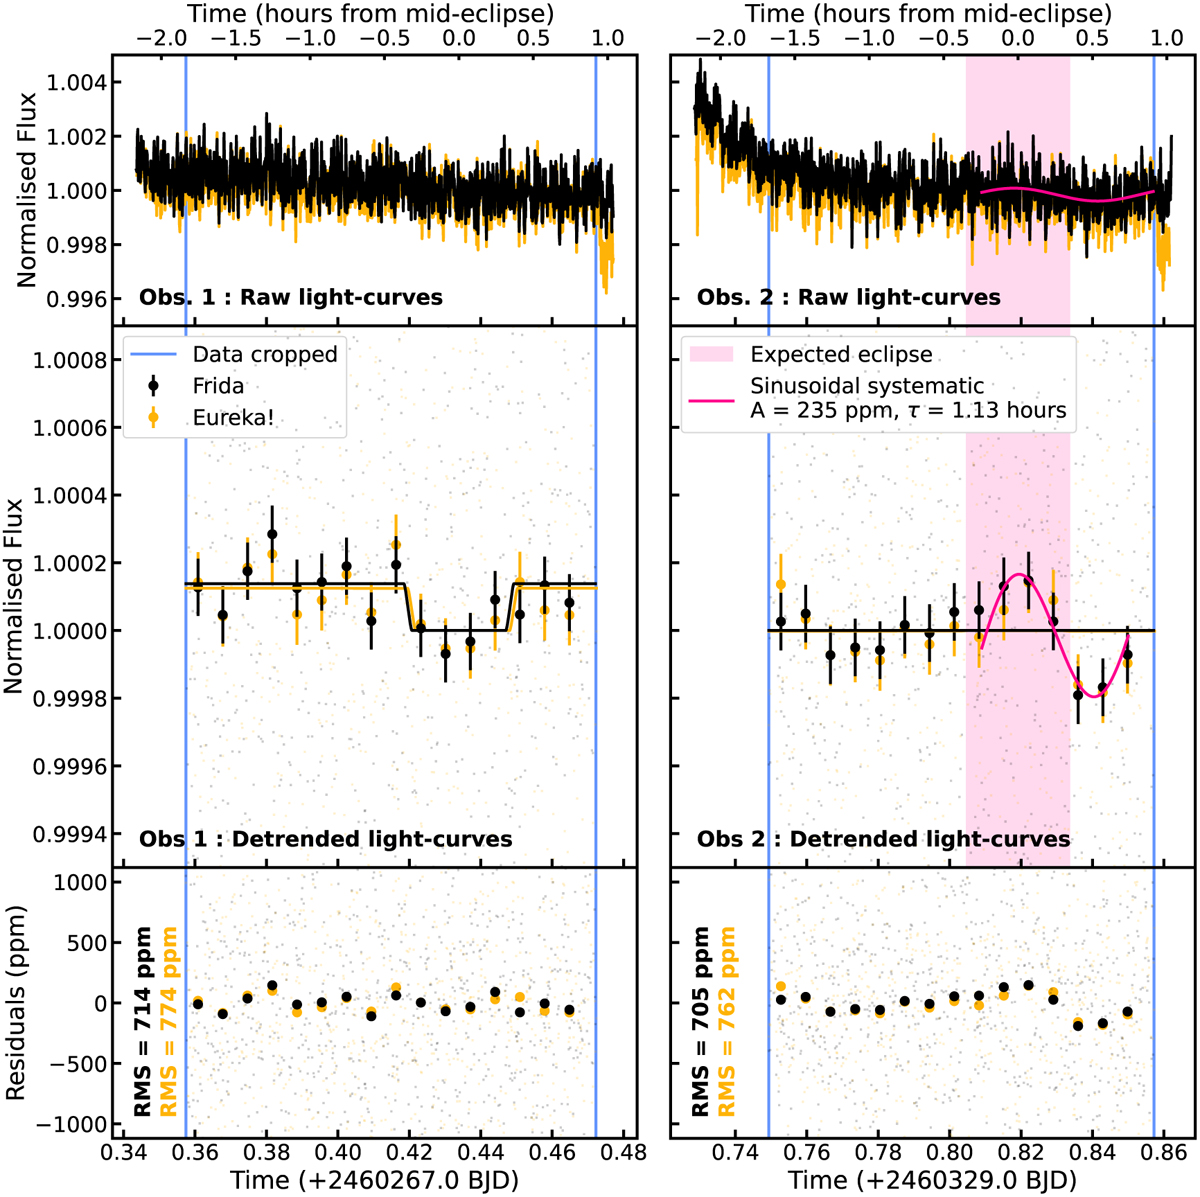
Raw and detrended light curves and residuals for the JWST/MIRI eclipse observations at 15 µm for LHS-1478 b. The data and model from our nominal Frida reduction are shown in black, while the Eureka! equivalent is shown in orange. Note that in this plot the second visit was detrended using an exponential and a linear slope (EL) for Frida, and a simple linear slope (L) for Eureka!, after the detector settling slope was removed, and without an eclipse model. For the first visit we use a simple linear slope to model the systematics for both reductions, after discarding some initial and final integrations (see Section 4). For the second visit, the expected eclipse timing, computed based on the first visit, is represented as a purple shaded region between ingress and egress, and we highlight in red the unexplained systematic (referred to later on as ‘’sinusoidal-like’ systematic).
Current usage metrics show cumulative count of Article Views (full-text article views including HTML views, PDF and ePub downloads, according to the available data) and Abstracts Views on Vision4Press platform.
Data correspond to usage on the plateform after 2015. The current usage metrics is available 48-96 hours after online publication and is updated daily on week days.
Initial download of the metrics may take a while.