Fig. 9
Download original image
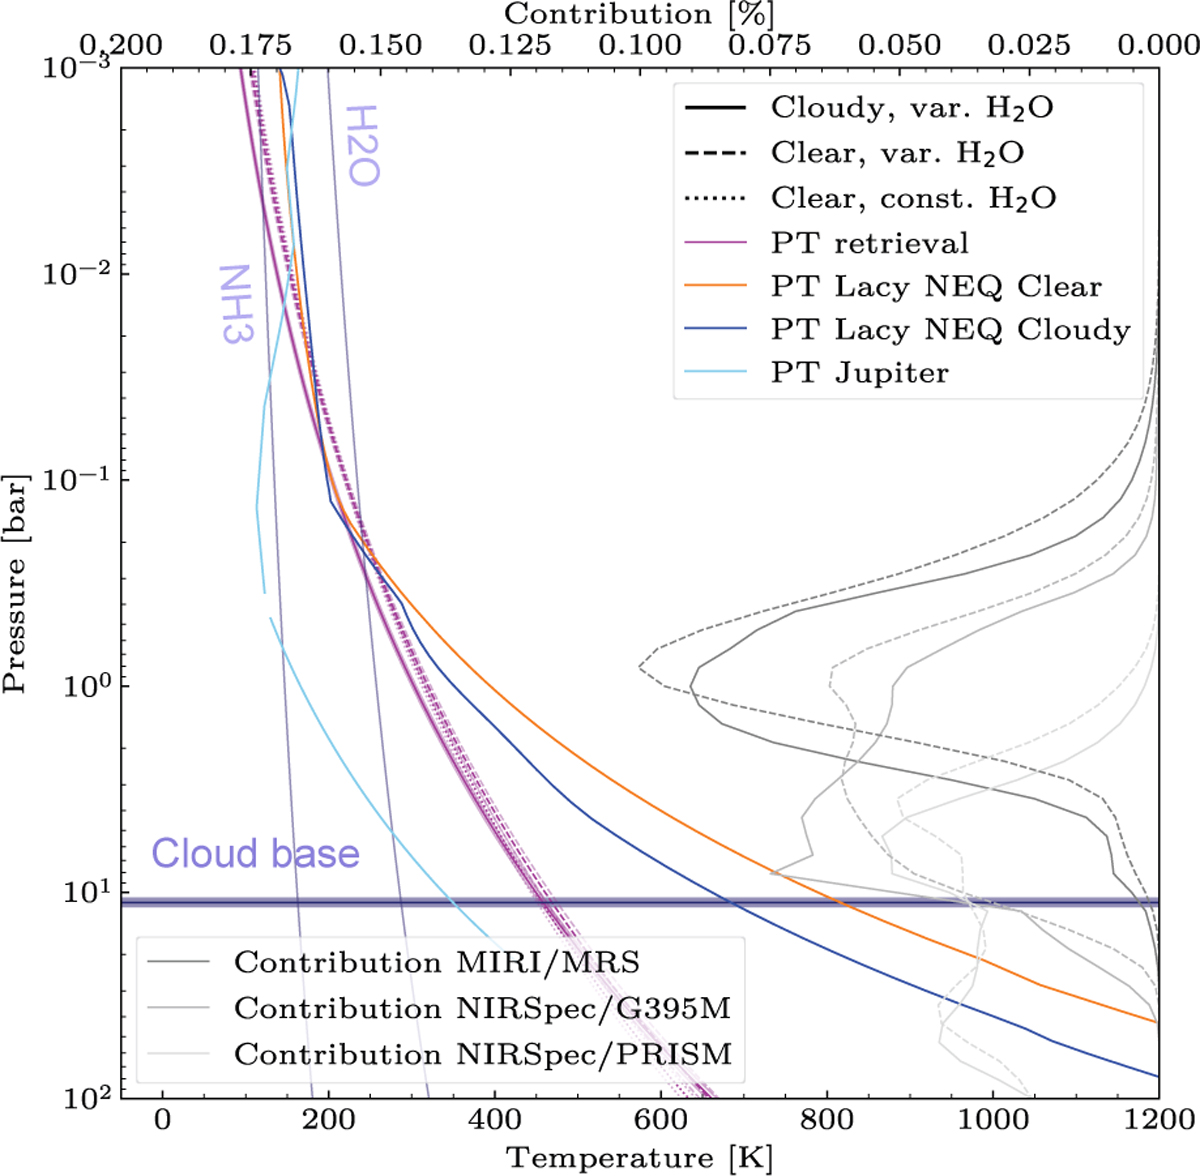
Pressure-temperature (PT) profiles of the retrievals in magenta compared to the H2O and NH3 condensation curves in violet and the contribution functions of MIRI/MRS, NIRSpec/G395M and NIR- Spec/PRISM in gray. Solid lines correspond to the cloudy, variable water profile, dashed lines to the clear and variable water profile and dotted lines to the clear and constant water profile retrievals. We show the mean PT profiles of a 1000 randomly drawn profiles from the posterior distribution. Fainter lines correspond to plus minus one standard deviation from the distribution of profiles. In light blue we present the measured and interpolated PT profiles of Jupiter (Seiff et al. 1998). In blue we compare the pressure temperature profiles at 250K effective temperature of the Lacy NEQ Cloudy (thick) model for subsolar metallicity with the Lacy NEQ Clear model for supersolar metallicity in orange (Lacy & Burrows 2023). At around 10 bars, the height of the constrained cloud based is indicated. The condensation curves for NH3 and H2O are taken from Lodders & Fegley (2002) for solar metallicity.
Current usage metrics show cumulative count of Article Views (full-text article views including HTML views, PDF and ePub downloads, according to the available data) and Abstracts Views on Vision4Press platform.
Data correspond to usage on the plateform after 2015. The current usage metrics is available 48-96 hours after online publication and is updated daily on week days.
Initial download of the metrics may take a while.