Fig. 7
Download original image
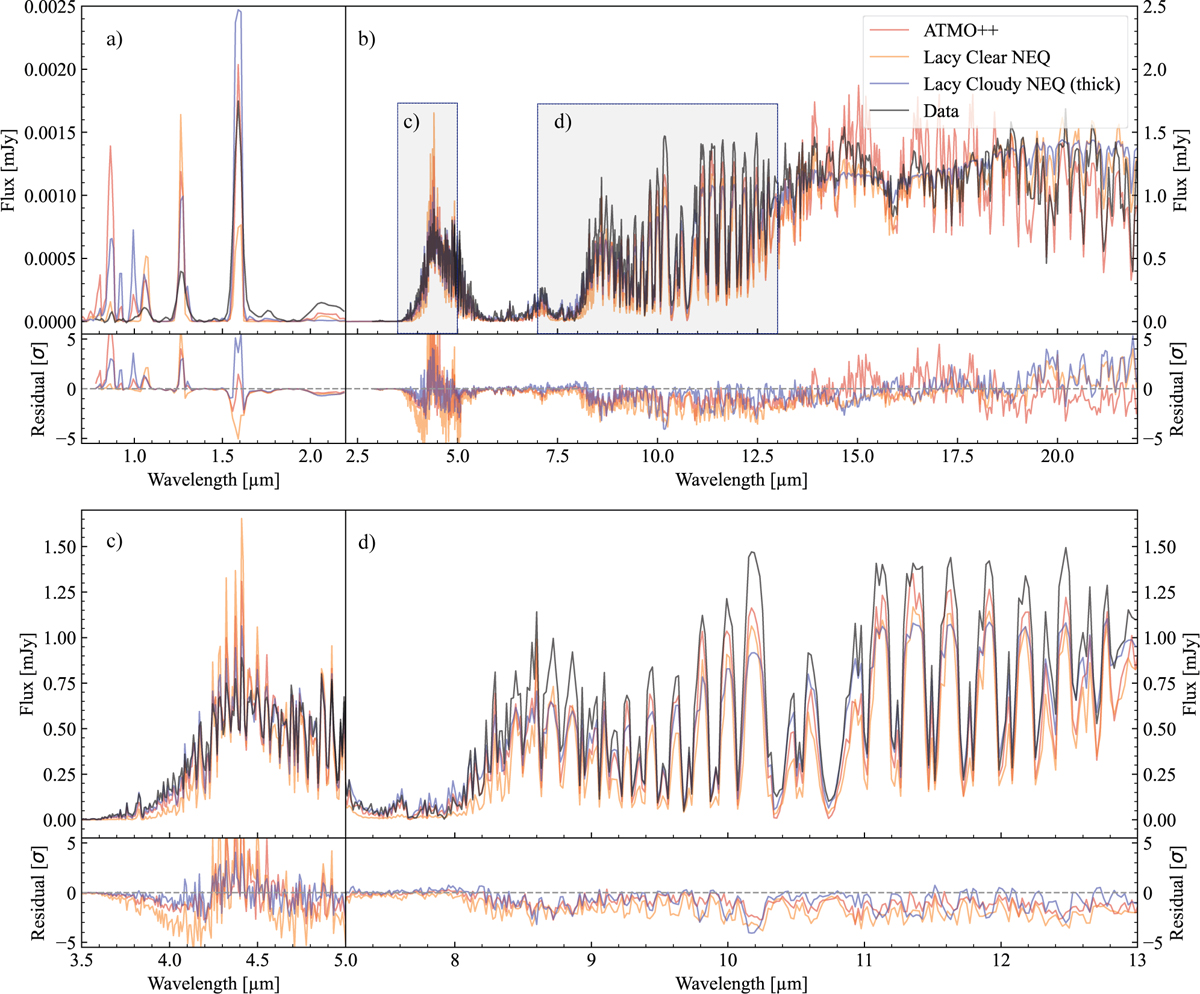
Best-fit grid model spectra for the clear ATMO++ in red, the thick cloudy non-equilibrium model by Lacy & Burrows (2023) in blue and the clear non-equilibrium in orange. Panel a: inset of the PRISM data, which has a significant lower amount of flux. Panel b: NIRSpec/G395M and MIRI/MRS dataset. Panels c and d: insets in panel b on the NIRSpec/G395M region and the prominent NH3 absorption feature. The corresponding χ2 values are 2.57, 1.97 and 5.66 for ATMO++, the Lacy cloudy (thick) and clear non-equilibrium model fits. As for the retrievals and for better visibility we re-bined the models and data to a resolution R = 500 for the NIRSpec/G395M and MIRI/MRS and kept NIRSpec/PRISM at R = 100.
Current usage metrics show cumulative count of Article Views (full-text article views including HTML views, PDF and ePub downloads, according to the available data) and Abstracts Views on Vision4Press platform.
Data correspond to usage on the plateform after 2015. The current usage metrics is available 48-96 hours after online publication and is updated daily on week days.
Initial download of the metrics may take a while.