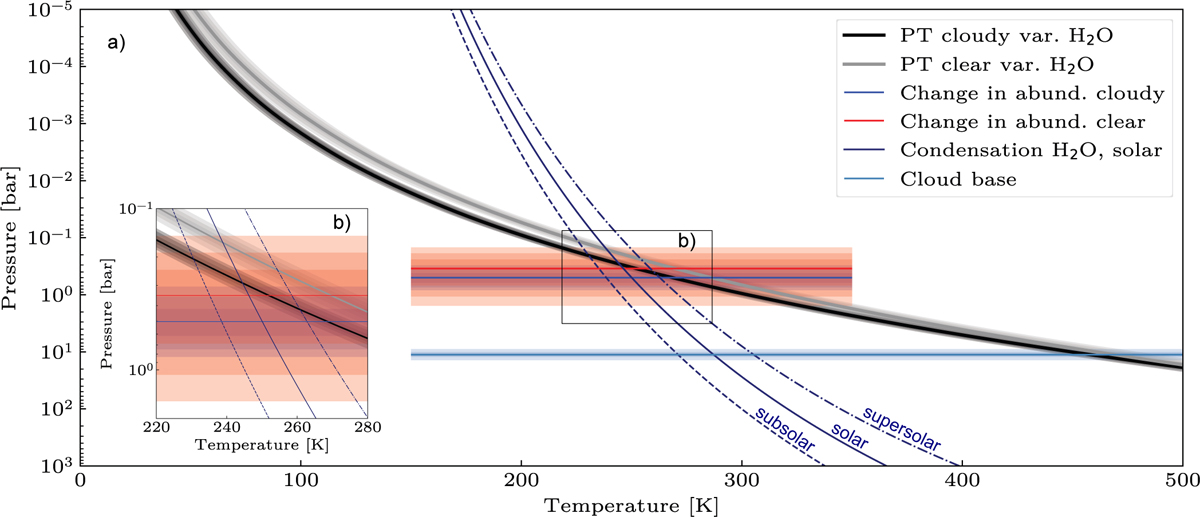
Fig. 4
Download original image
Intersection of the water condensation curve and the retrieved PT profiles compared to the retrieved pressure levels of water depletion. Panel a: median PT profiles for the clear retrieval in gray and the cloudy retrieval in black cross the water condensation curve for sub-, super- and solar metallicities (Lodders & Fegley 2002) shown in dark blue. In a dashed red line we present the freely chosen atmospheric layer, where the water abundances is decreased for the clear retrieval and in blue for the cloudy retrieval. We show one to three sigma envelopes around the median value for the change in water abundance. For both retrievals the crossing between the condensation curve and the PT profile happens at the pressure level chosen freely by the retrieval for the reduction in water abundance indicating that water is likely to condensate out at this height. Panel b: inset to better visualize the crossing area. The light blue line corresponds to the cloud base constrained by the retrieval.
Current usage metrics show cumulative count of Article Views (full-text article views including HTML views, PDF and ePub downloads, according to the available data) and Abstracts Views on Vision4Press platform.
Data correspond to usage on the plateform after 2015. The current usage metrics is available 48-96 hours after online publication and is updated daily on week days.
Initial download of the metrics may take a while.