Fig. 3
Download original image
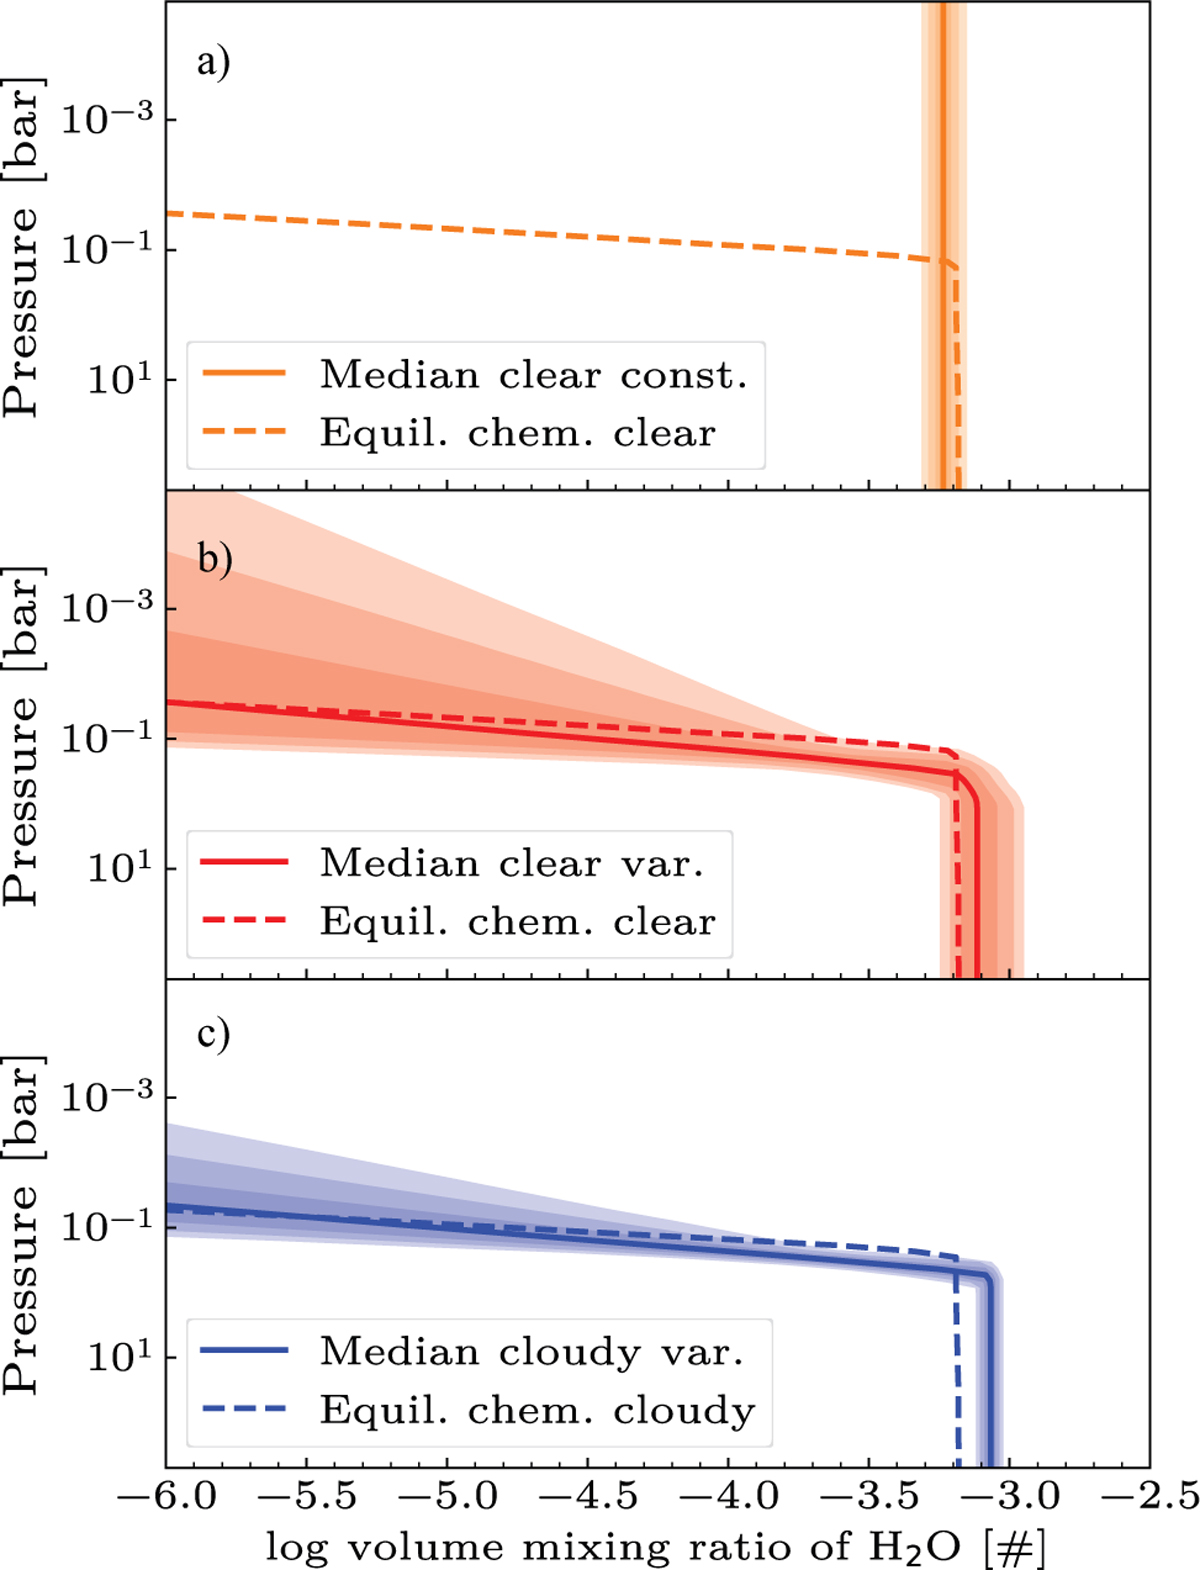
Logarithmic volume mixing ratios varying with pressure for the three shown retrieval results. Panel a: retrieved median clear and constant water profile (solid orange line) and equilibrium chemistry prediction based on the retrieved PT structure (dashed line). Panels b and c: analogs for the clear retrieval with variable water profile (in red), and for the cloudy and variable water profile retrieval (in blue). One to three sigma envelopes are shown around the retrieved profiles. The profiles where parameterized using Eq. (2).
Current usage metrics show cumulative count of Article Views (full-text article views including HTML views, PDF and ePub downloads, according to the available data) and Abstracts Views on Vision4Press platform.
Data correspond to usage on the plateform after 2015. The current usage metrics is available 48-96 hours after online publication and is updated daily on week days.
Initial download of the metrics may take a while.