Fig. 2
Download original image
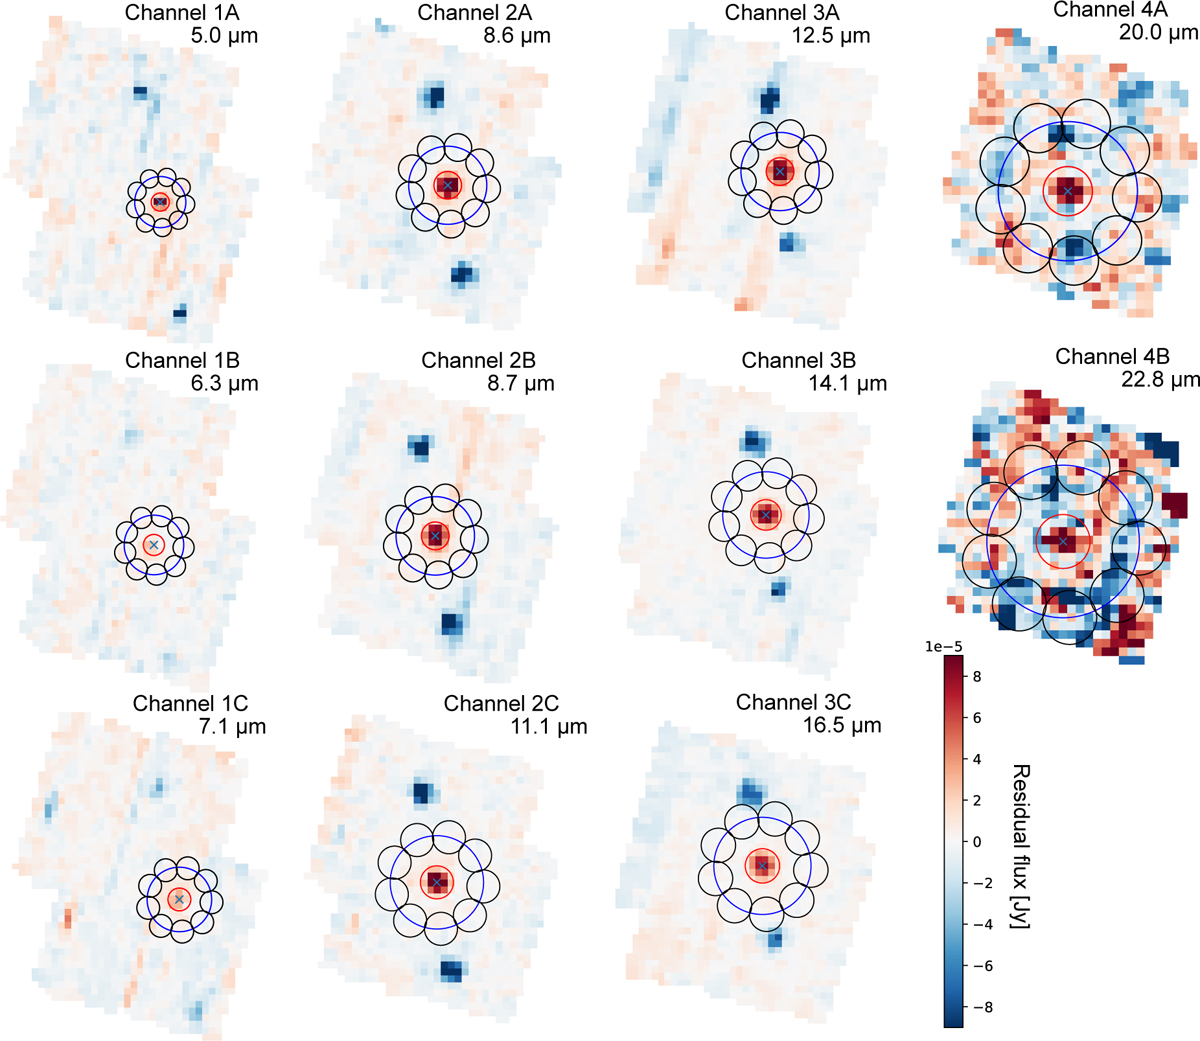
Resulting cube images of channels 1 to 4 with subchannels A to C after dither subtraction. The wavelengths are chosen such that they refer to the detector image with the highest flux at the source in each band. The red circle shows the aperture for the flux extraction of the spectrum at one FWHM of the PSF of the source. The blue circle refers to three times the FWHM on which nine black circles of one FWHM are placed. We extract the flux from each circle and measure the variability to obtain an error that includes the noise in the background, σemp.
Current usage metrics show cumulative count of Article Views (full-text article views including HTML views, PDF and ePub downloads, according to the available data) and Abstracts Views on Vision4Press platform.
Data correspond to usage on the plateform after 2015. The current usage metrics is available 48-96 hours after online publication and is updated daily on week days.
Initial download of the metrics may take a while.