Fig. 6.
Download original image
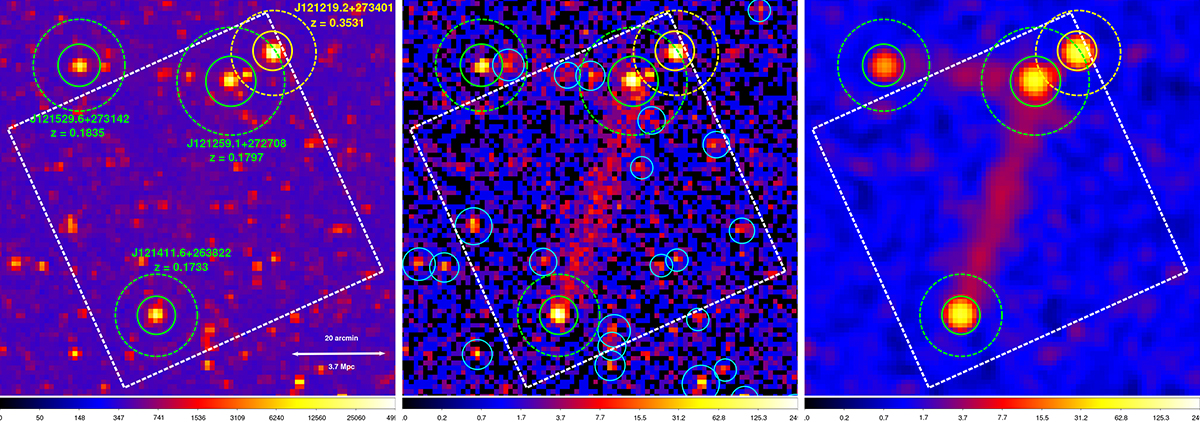
Mock images of 200 ks HUBS exposure for J1214+2712. Left: counts map of the 0.1–2.0 band; Middle: O VIII narrowband (0.553–0.559 keV) counts map; Right: O VIII narrowband count map with point sources masked and filled and Gaussian filter applied. Solid and dashed circles represent R500 and Rvir respectively for modeled galaxy clusters (green for the three clusters in the 1eRASS-SC J1214+2712 system, and yellow for the background cluster), cyan circles represent point sources, and the white dashed box in each panel represents the HUB FoV.
Current usage metrics show cumulative count of Article Views (full-text article views including HTML views, PDF and ePub downloads, according to the available data) and Abstracts Views on Vision4Press platform.
Data correspond to usage on the plateform after 2015. The current usage metrics is available 48-96 hours after online publication and is updated daily on week days.
Initial download of the metrics may take a while.