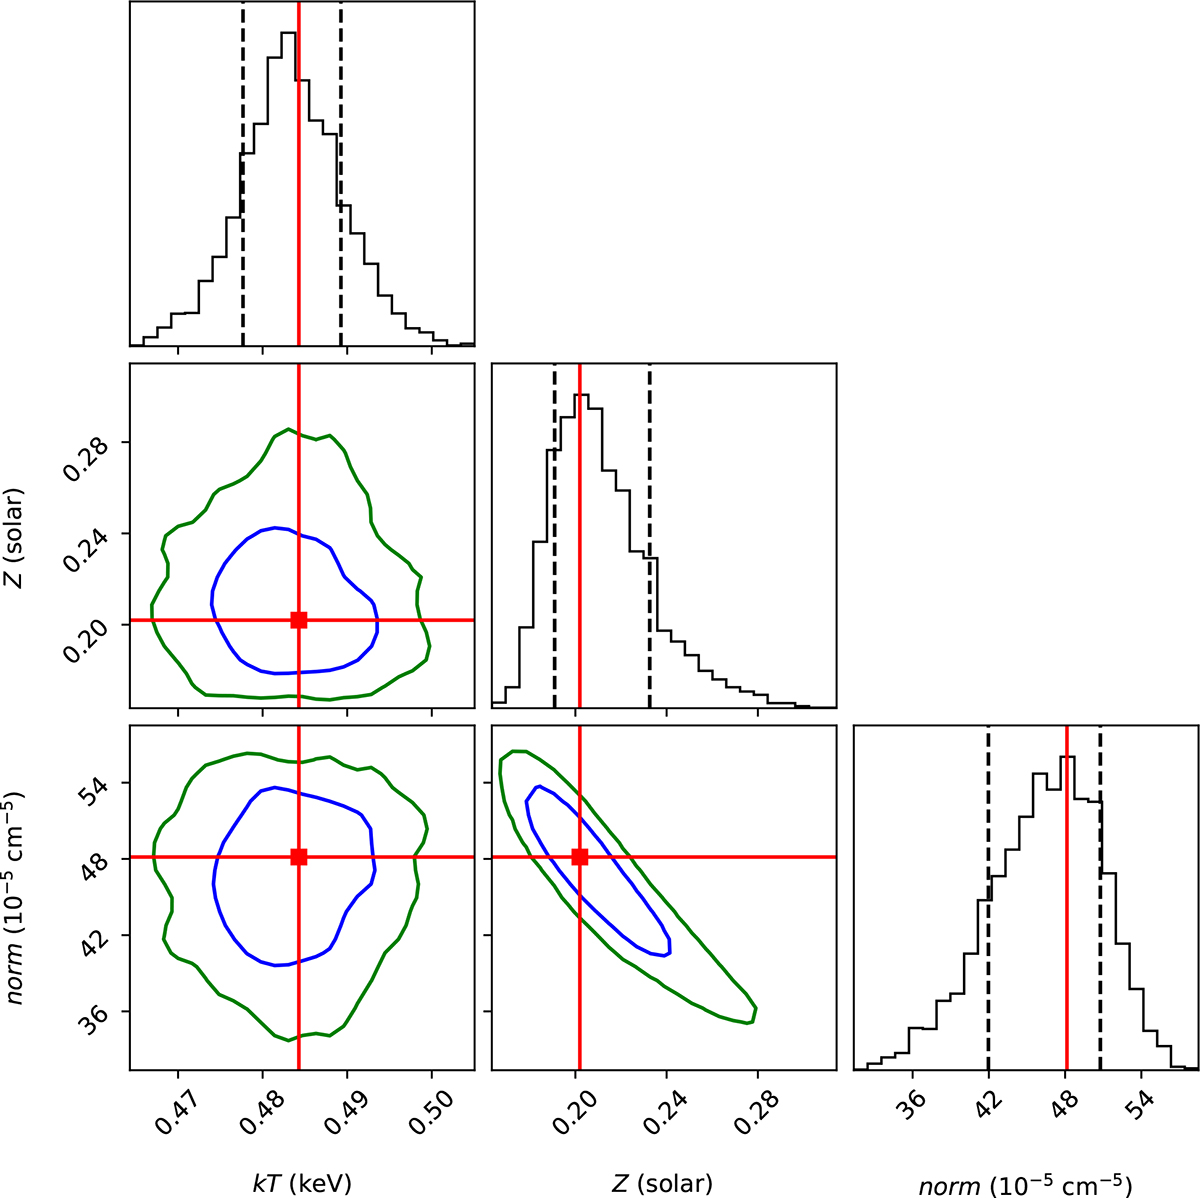
Fig. 5.
Download original image
Probability density distributions of parameters kT, Z, and norm of the “full length” 200 ks mock spectra of J1214+2712. The red points and lines represent the best-fit values. The blue and green contours represent 68% and 95% confidence levels. The dashed vertical lines on the 1-D histograms represent 68% confidence interval of each parameter.
Current usage metrics show cumulative count of Article Views (full-text article views including HTML views, PDF and ePub downloads, according to the available data) and Abstracts Views on Vision4Press platform.
Data correspond to usage on the plateform after 2015. The current usage metrics is available 48-96 hours after online publication and is updated daily on week days.
Initial download of the metrics may take a while.