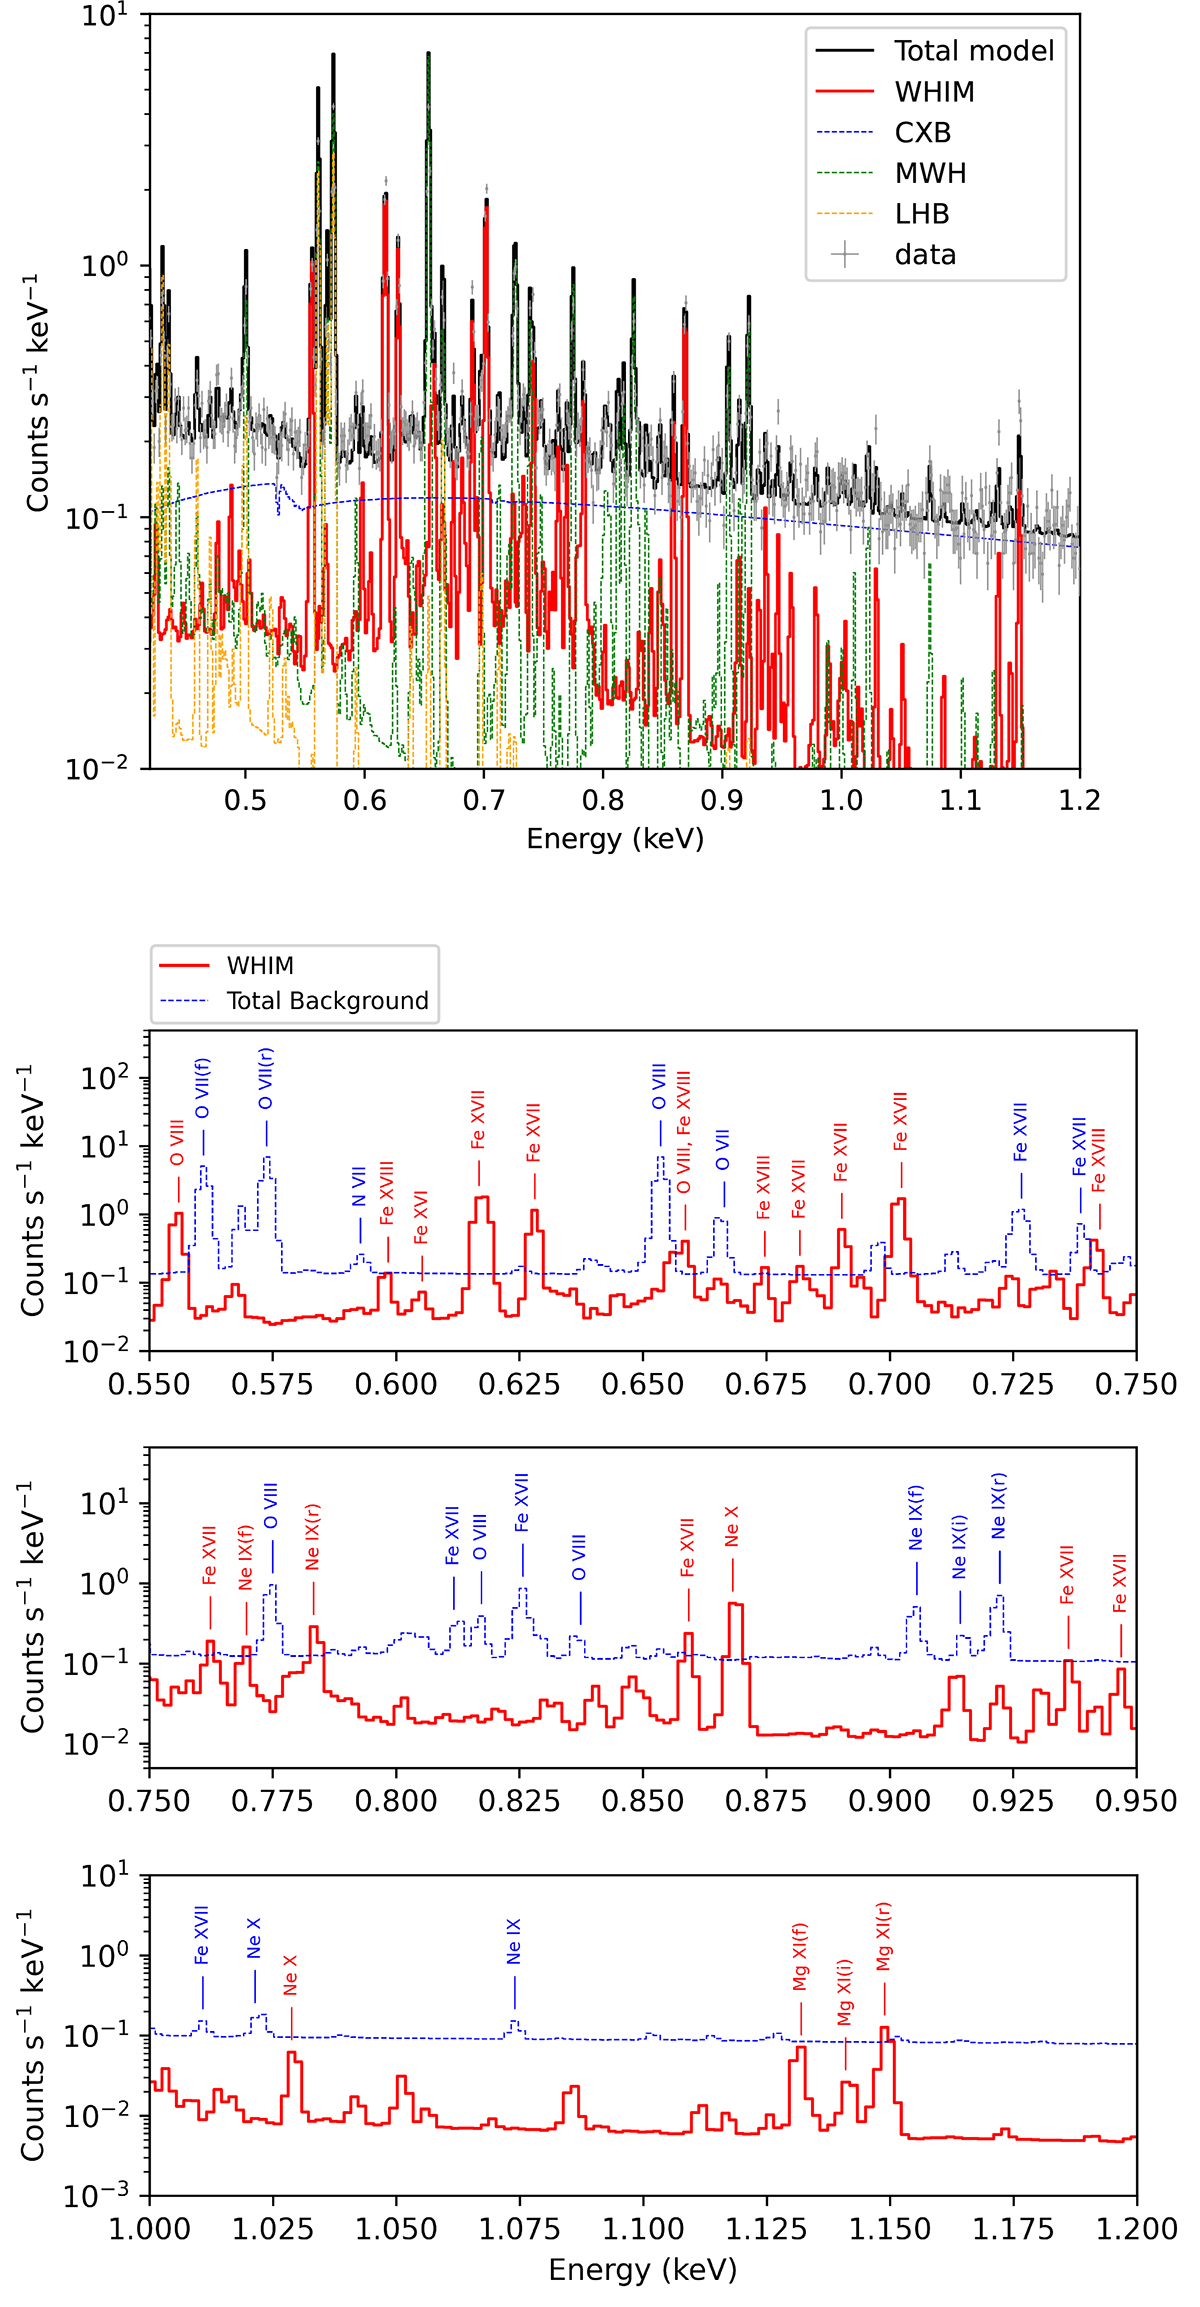
Fig. 4.
Download original image
Mock spectra of the “full length” region of J1214+2712. Top panel: Mock data (grey crosses) and best-fit model (black solid line). Components of the model are also shown (WHIM in red solid line, CXB in blue dashed line, MWH in cyan dashed line, and LHB in orange dashed line). Bottom panel: Zoom-in spectra of the WHIM (red solid line) and the total background (blue dashed line) with prominent emission lines labeled.
Current usage metrics show cumulative count of Article Views (full-text article views including HTML views, PDF and ePub downloads, according to the available data) and Abstracts Views on Vision4Press platform.
Data correspond to usage on the plateform after 2015. The current usage metrics is available 48-96 hours after online publication and is updated daily on week days.
Initial download of the metrics may take a while.