Fig. 3.
Download original image
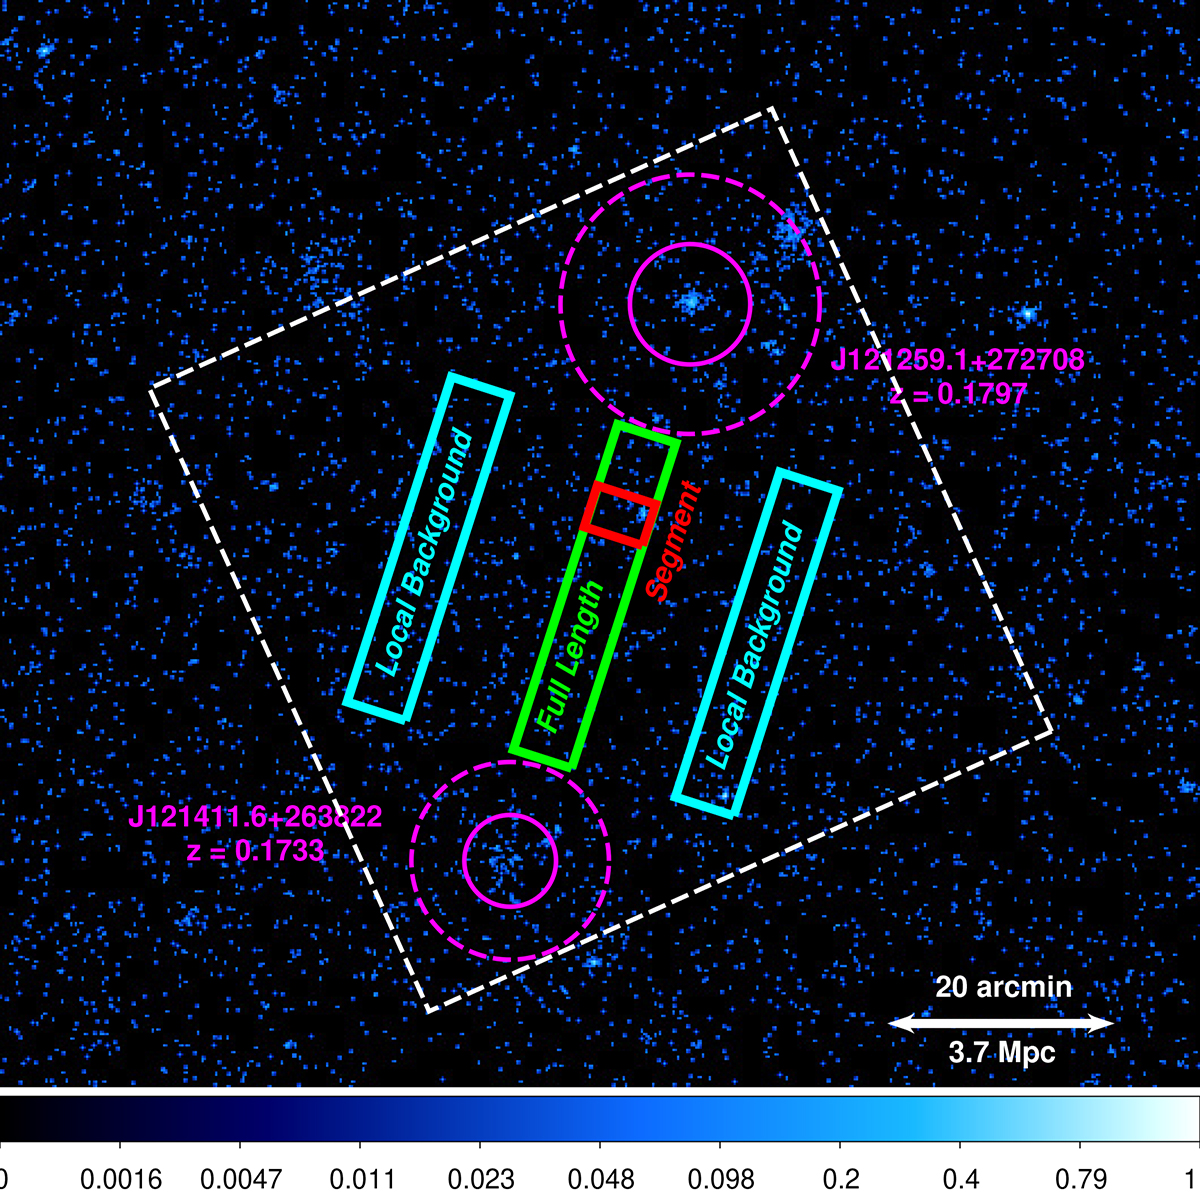
Regions used to extract filament and background spectra for the case of J1214+2712. The image was generated from 0.2–2.0 keV event lists from eRASS1 data. The green solid box represents the “full length” region, the red solid box represents the “segment” region, and the cyan solid boxes represent the region used for “local background” extraction. The magenta solid and dashed circles represent R500 and Rvir of the clusters, and the white dashed box is HUBS FoV of 1° ×1°.
Current usage metrics show cumulative count of Article Views (full-text article views including HTML views, PDF and ePub downloads, according to the available data) and Abstracts Views on Vision4Press platform.
Data correspond to usage on the plateform after 2015. The current usage metrics is available 48-96 hours after online publication and is updated daily on week days.
Initial download of the metrics may take a while.