Fig. A.1
Download original image
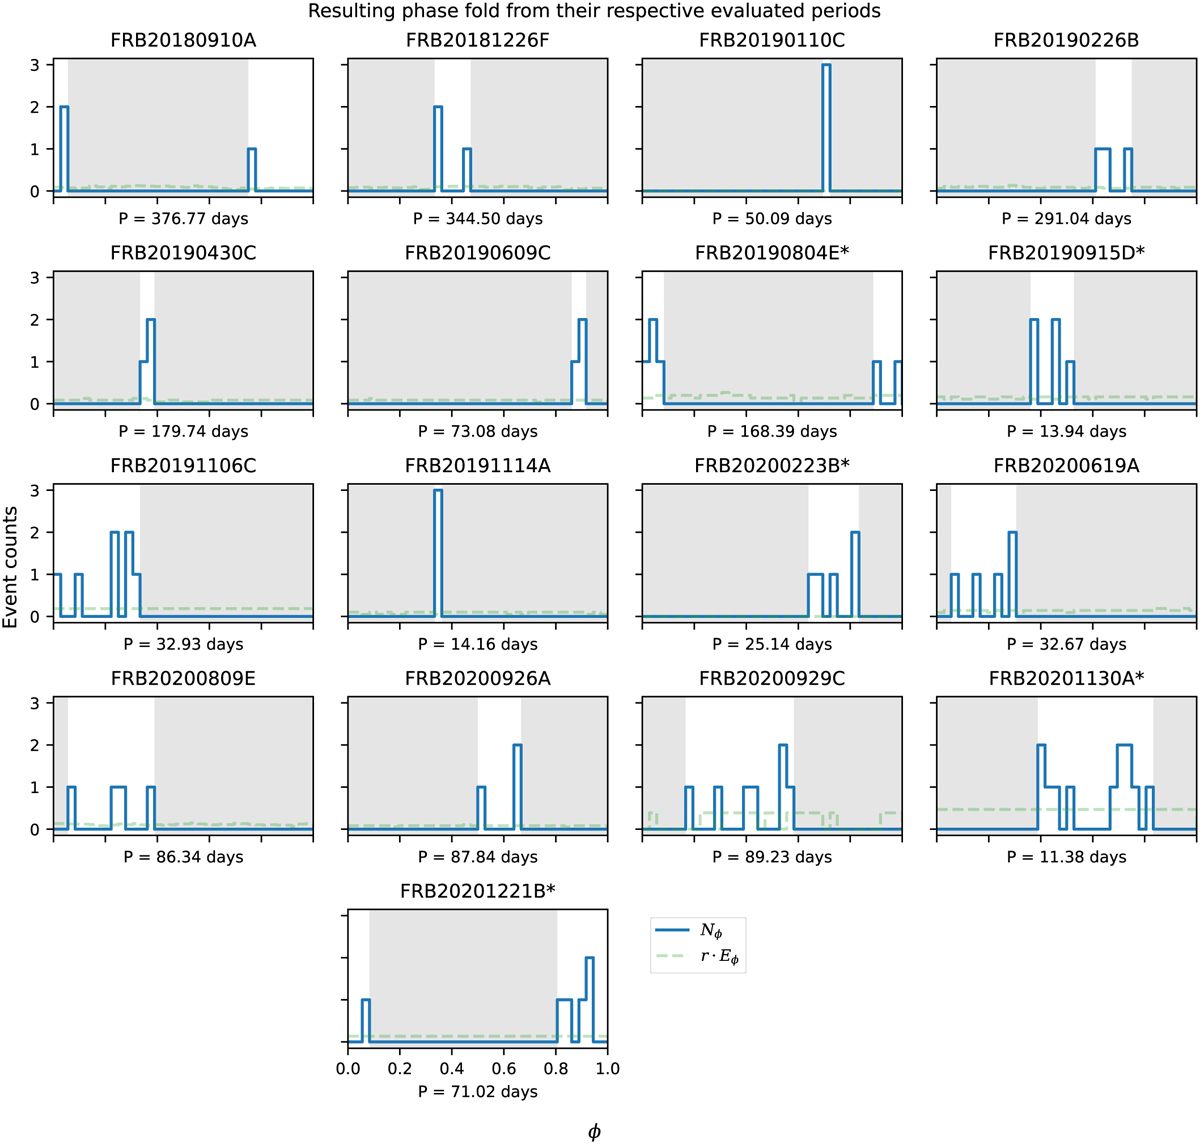
Phase-folded data for our sample of 17 repeaters showing the distribution of activities as a function of phase. The data is folded at their respective evaluated periods. The blue solid line shows the event count at the phase bin. The green dashed line shows the uniform expectation function derived from the exposure function and burst rate. The grey span shows the inactive region whose length is F0. FRBs with an asterisk near their name are FRBs with Pcc ≥ 0.050.
Current usage metrics show cumulative count of Article Views (full-text article views including HTML views, PDF and ePub downloads, according to the available data) and Abstracts Views on Vision4Press platform.
Data correspond to usage on the plateform after 2015. The current usage metrics is available 48-96 hours after online publication and is updated daily on week days.
Initial download of the metrics may take a while.