Open Access
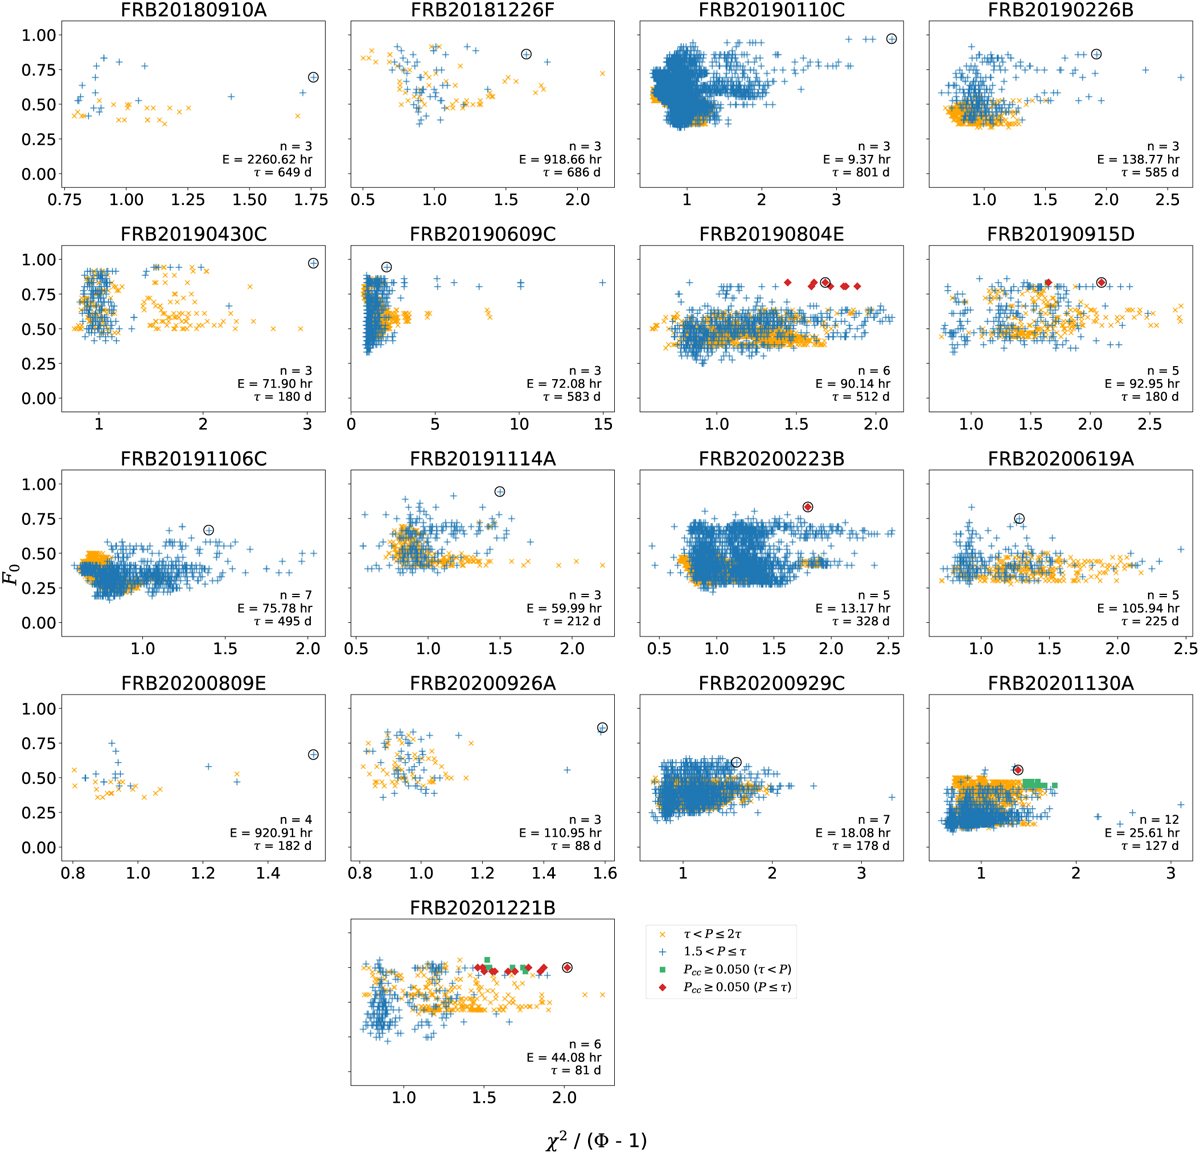
Fig. 5
Download original image
Metric-metric plot for sample of 17 repeaters. The colours have the same meaning as in Fig. 4. The grid-like structure found along the F0 direction occurs because it is an integer multiple of the phase-bin width (see Sect. 3.2). Some repeaters show no primary tail, but we still circle the Pcc with the lowest value.
Current usage metrics show cumulative count of Article Views (full-text article views including HTML views, PDF and ePub downloads, according to the available data) and Abstracts Views on Vision4Press platform.
Data correspond to usage on the plateform after 2015. The current usage metrics is available 48-96 hours after online publication and is updated daily on week days.
Initial download of the metrics may take a while.