Fig. 4
Download original image
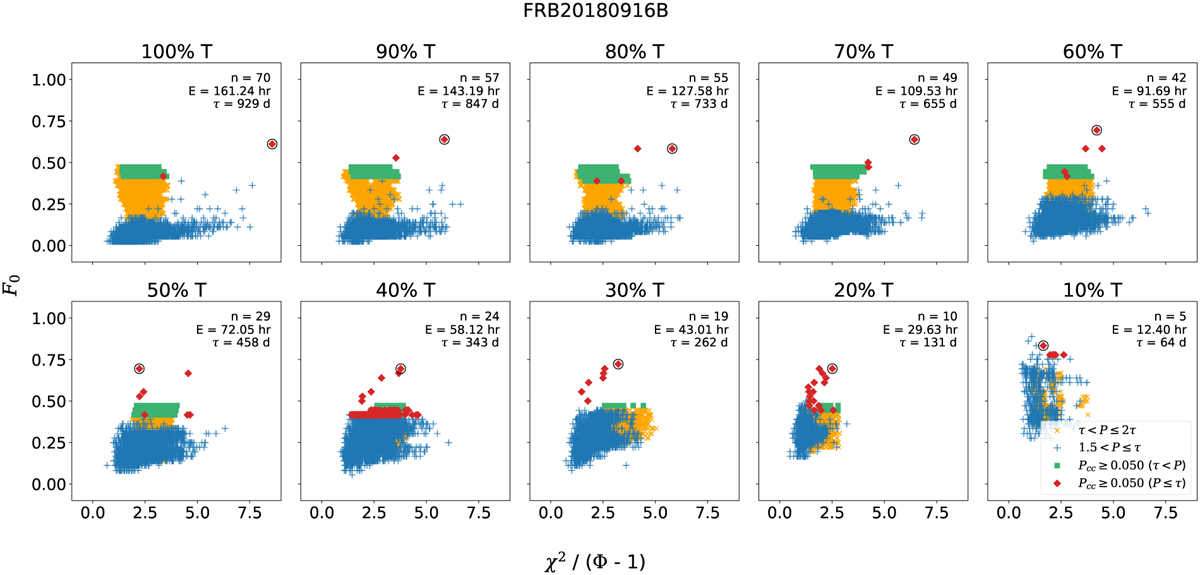
Metric-metric plot for different observation windows (T=977 days) of FRB 20180916B. The blue plus sign and red diamonds represent the primary period range, while the orange cross and the green square represent the secondary period range. The red diamond (primary tail) and the green square (secondary tail) represent trial periods that cross the Pcc ≤ 0.050 threshold for their respective period ranges. The point circled in black denotes the lowest Pcc.
Current usage metrics show cumulative count of Article Views (full-text article views including HTML views, PDF and ePub downloads, according to the available data) and Abstracts Views on Vision4Press platform.
Data correspond to usage on the plateform after 2015. The current usage metrics is available 48-96 hours after online publication and is updated daily on week days.
Initial download of the metrics may take a while.