Fig. 1
Download original image
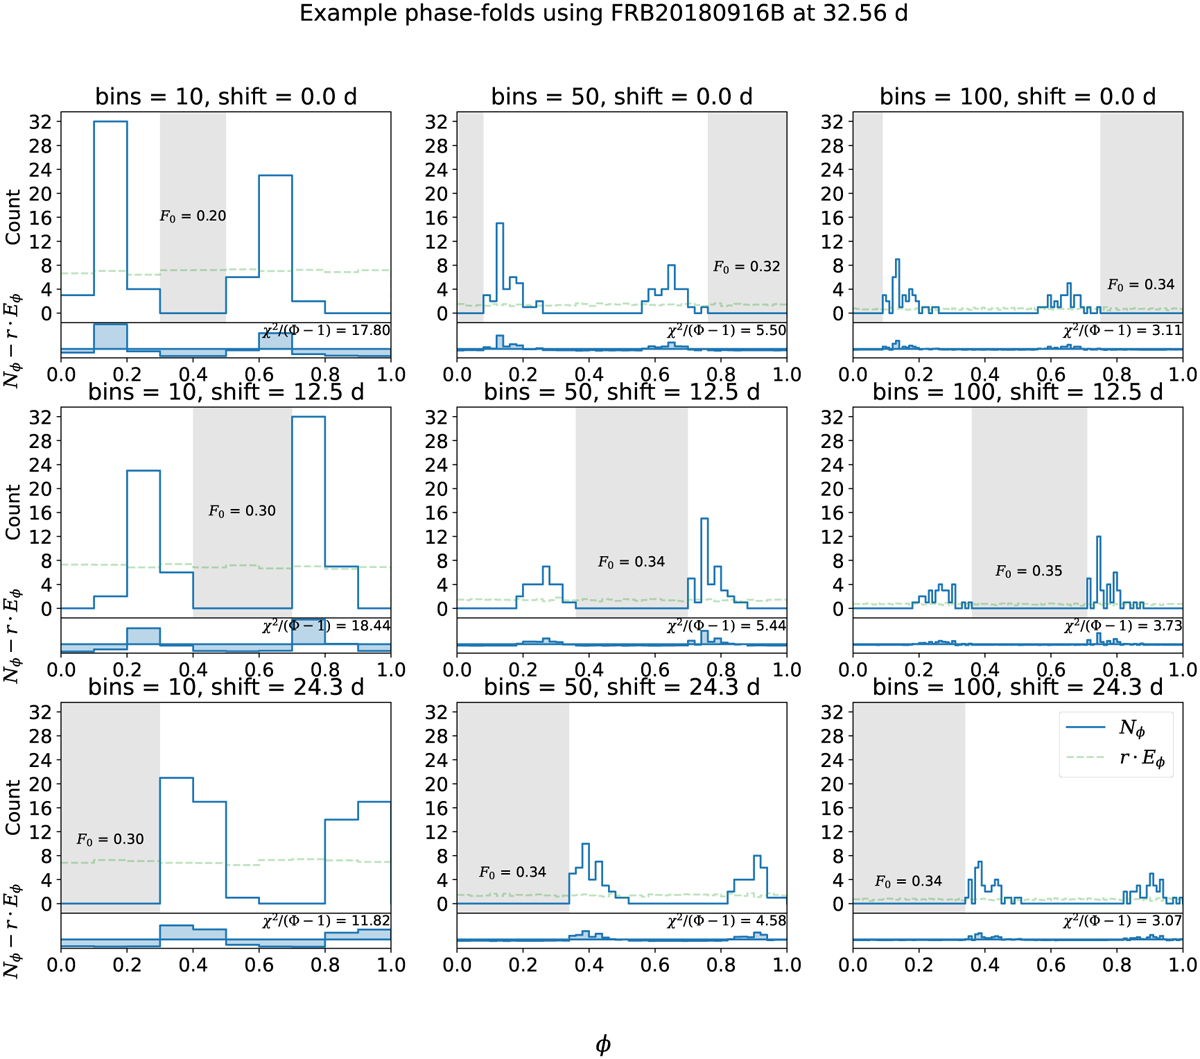
Example phase-folds using FRB 20180916B at 32.56 days with different bin numbers and phase-origin shifts. For each sub-figure, the top figure is the histogram of observed bursts (solid blue) and uniform expectation (dashed green) in each phase bin with the residue displayed in the bottom figure. The χ2 metric is proportional to the sum of the squared value of this residue. The grey span in the histogram shows the inactivity fraction (F0).
Current usage metrics show cumulative count of Article Views (full-text article views including HTML views, PDF and ePub downloads, according to the available data) and Abstracts Views on Vision4Press platform.
Data correspond to usage on the plateform after 2015. The current usage metrics is available 48-96 hours after online publication and is updated daily on week days.
Initial download of the metrics may take a while.