Fig. A.1
Download original image
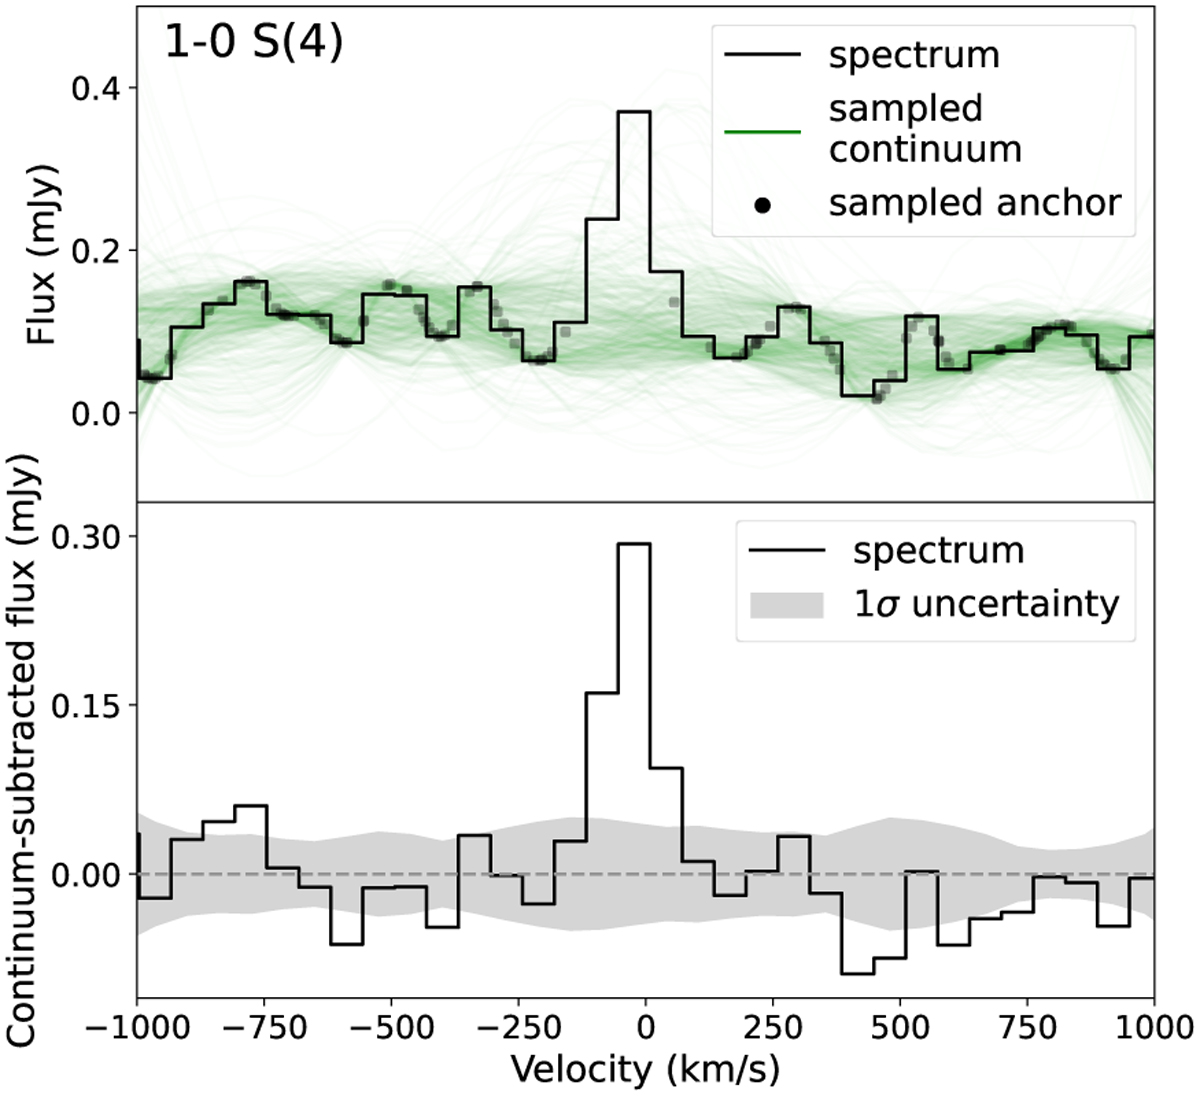
Example of a continuum fit and the estimation of its uncertainty for the near-infrared 1−0 S(4) line in AP2 (see Figure C.1). Top: The green lines indicate quadratic spline continuum fits through the sampled black anchor points. Only one in 30 sampled anchor points are shown for clarity. More opaque black or green colouring can be interpreted as a higher density of anchor points or continuum fits respectively. Bottom: The continuum-subtracted spectrum is plotted. The shaded area indicates the 1σ uncertainty of the continuum fits in each spectral bin.
Current usage metrics show cumulative count of Article Views (full-text article views including HTML views, PDF and ePub downloads, according to the available data) and Abstracts Views on Vision4Press platform.
Data correspond to usage on the plateform after 2015. The current usage metrics is available 48-96 hours after online publication and is updated daily on week days.
Initial download of the metrics may take a while.