Fig. 7
Download original image
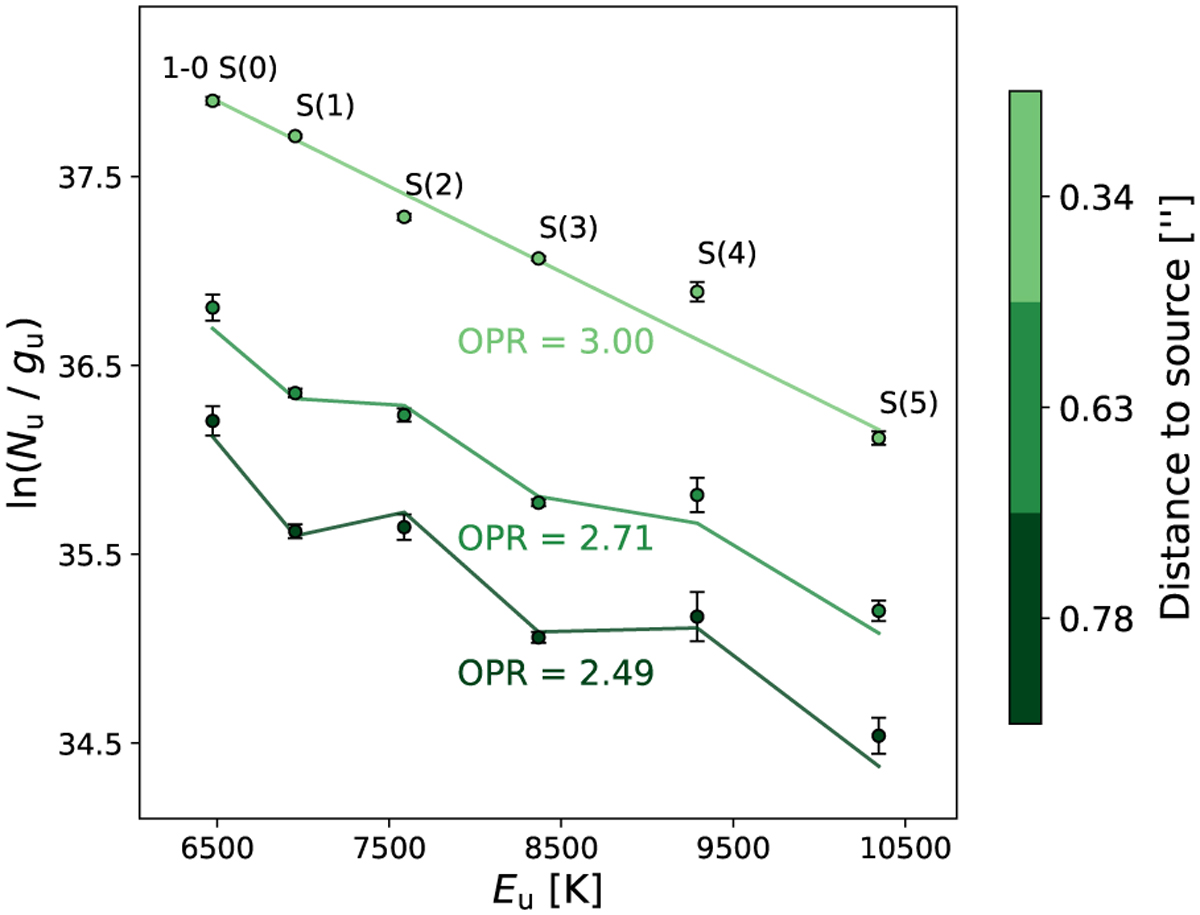
Rotation diagrams for ro-vibrational H2 emission in three apertures at various distances (in the image plane) from the source. The ortho-to-para ratio (OPR) decreases further from the source. The temperature and column density corresponding to each fit are listed in Table 3. Plotted uncertainties do not include the extinction uncertainty, which affects each curve as illustrated in Figure 8.
Current usage metrics show cumulative count of Article Views (full-text article views including HTML views, PDF and ePub downloads, according to the available data) and Abstracts Views on Vision4Press platform.
Data correspond to usage on the plateform after 2015. The current usage metrics is available 48-96 hours after online publication and is updated daily on week days.
Initial download of the metrics may take a while.