Fig. 6
Download original image
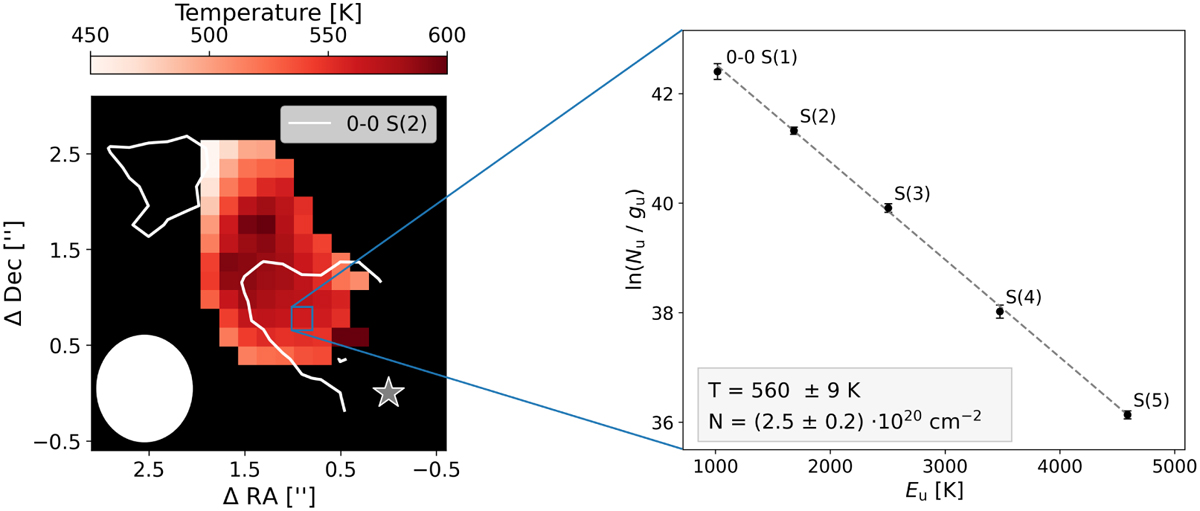
0–0 S(l)–S(5) temperature map as derived from 0–0 S(l)–S(5) rotation diagrams. Left: the temperature map, with white contours derived from 0–0 S(2) emission outlining the positions of knot A and B. The white circle indicates the PSF FWHM that each transition integrated flux map has been smoothed to. Right: example of a single-spaxel rotation diagram. The measurements follow a straight line characterised by the temperature T and column density N as indicated in the grey box.
Current usage metrics show cumulative count of Article Views (full-text article views including HTML views, PDF and ePub downloads, according to the available data) and Abstracts Views on Vision4Press platform.
Data correspond to usage on the plateform after 2015. The current usage metrics is available 48-96 hours after online publication and is updated daily on week days.
Initial download of the metrics may take a while.