Fig. 5
Download original image
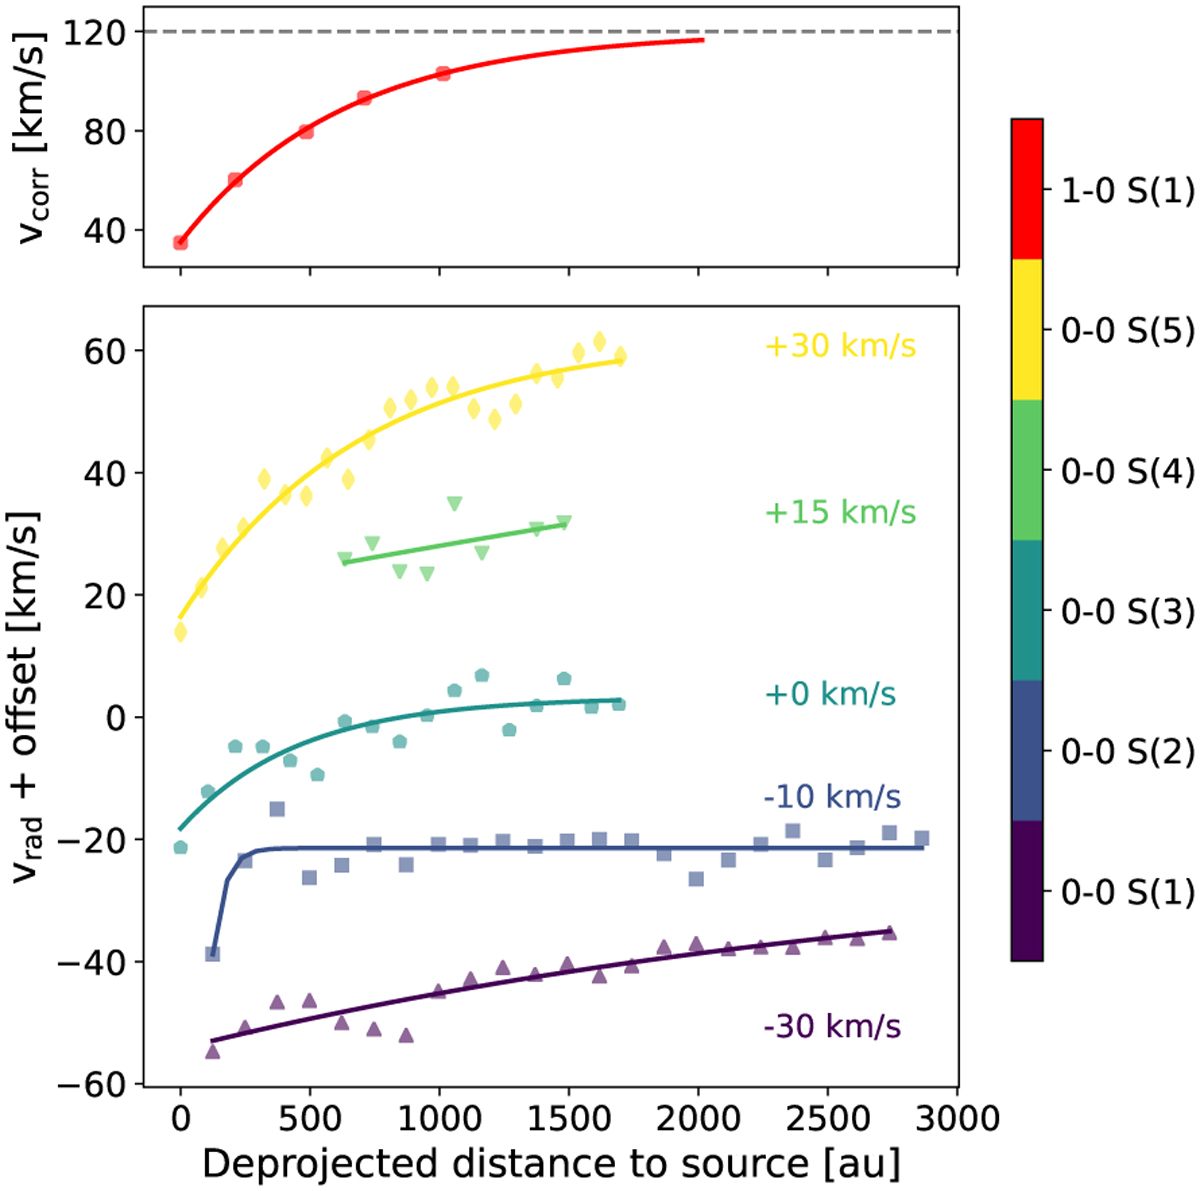
Corrected (1–0 S(1), top) and radial (0–0 S(1)–S(5), bottom) velocity profiles, respectively υcor and υrad . Positive velocity values correspond to blueshift. Each datapoint in the pure rotational molecular hydrogen curves is the median velocity along the spaxel column of the rotated image, while the 1–0 S(1) curve is derived from several apertures along the jet axis (see Section 3.2). The solid curves are exponential fits to the data. The rotational transition curves are offset for clarity. The offset for each curve is annotated in the figure in the same colour.
Current usage metrics show cumulative count of Article Views (full-text article views including HTML views, PDF and ePub downloads, according to the available data) and Abstracts Views on Vision4Press platform.
Data correspond to usage on the plateform after 2015. The current usage metrics is available 48-96 hours after online publication and is updated daily on week days.
Initial download of the metrics may take a while.