Fig. 3
Download original image
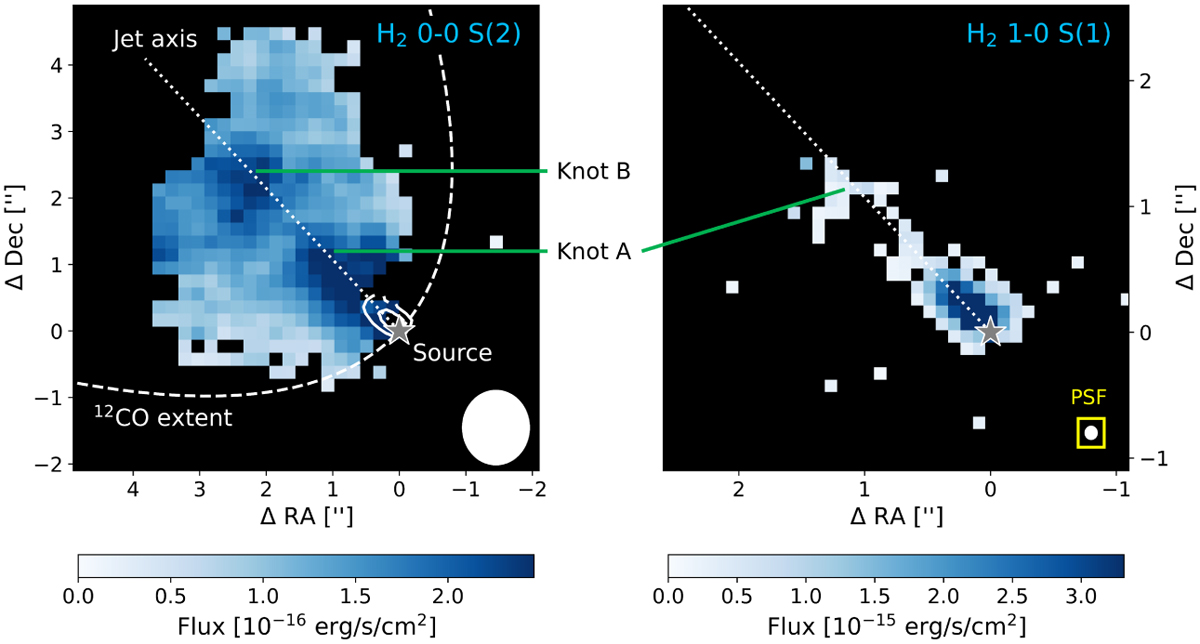
Molecular hydrogen 0–0 S(2) (left) and 1–0 S(1) (right) integrated flux maps of HOPS 315. The maps are derived from Gaussian fits to the emission lines in each spaxel. Black spaxels indicate spaxels where no line with a peak continuum-subtracted flux >5σ was detected (where σ is the continuum uncertainty) or that are out of the image field of view. White circles illustrate the size of the PSF FWHM at the transition wavelength. The dotted line indicates the jet axis, originating from the source (grey star). Two flux peaks can be identified in the left image, labelled with knot A and B. The former is also visible in the right image. Left: the white contours show the collimated 1–0 S(1) emission. The dashed-line parabola indicates the extent of the 2–1 12CO emission (230 GHz) observed by Dutta et al. (2022). Right: the NIRSpec PSF is surrounded by a yellow box such that it is easier to spot.
Current usage metrics show cumulative count of Article Views (full-text article views including HTML views, PDF and ePub downloads, according to the available data) and Abstracts Views on Vision4Press platform.
Data correspond to usage on the plateform after 2015. The current usage metrics is available 48-96 hours after online publication and is updated daily on week days.
Initial download of the metrics may take a while.