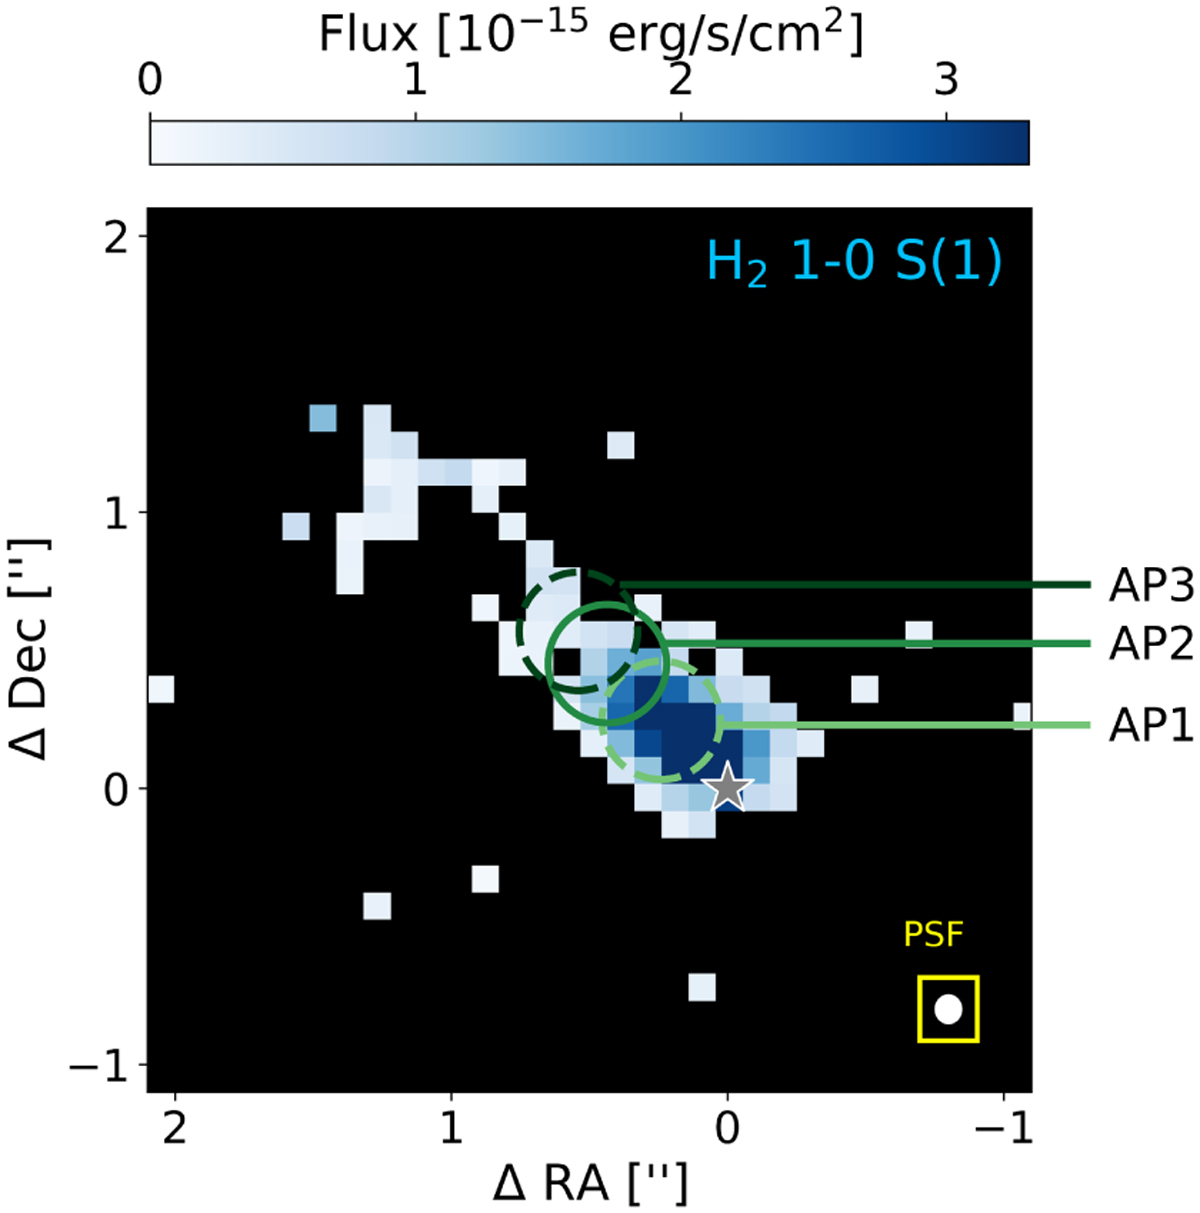
Fig. C.1
Download original image
Continuum subtracted integrated flux map for the near-infrared transition 1−0 S(1). The grey star indicates the position of the protostar. The apertures used to construct rotation diagrams are indicated with green circles, where AP2 corresponds to the spectrum plotted in Figure 2. Each coloured spaxel corresponds to a Gaussian fit with a peak height larger than 5σ, with σ indicating the uncertainty on the continuum flux as described in Appendix A. The white circle in the bottom right indicates the PSF FWHM at the transition wavelength.
Current usage metrics show cumulative count of Article Views (full-text article views including HTML views, PDF and ePub downloads, according to the available data) and Abstracts Views on Vision4Press platform.
Data correspond to usage on the plateform after 2015. The current usage metrics is available 48-96 hours after online publication and is updated daily on week days.
Initial download of the metrics may take a while.