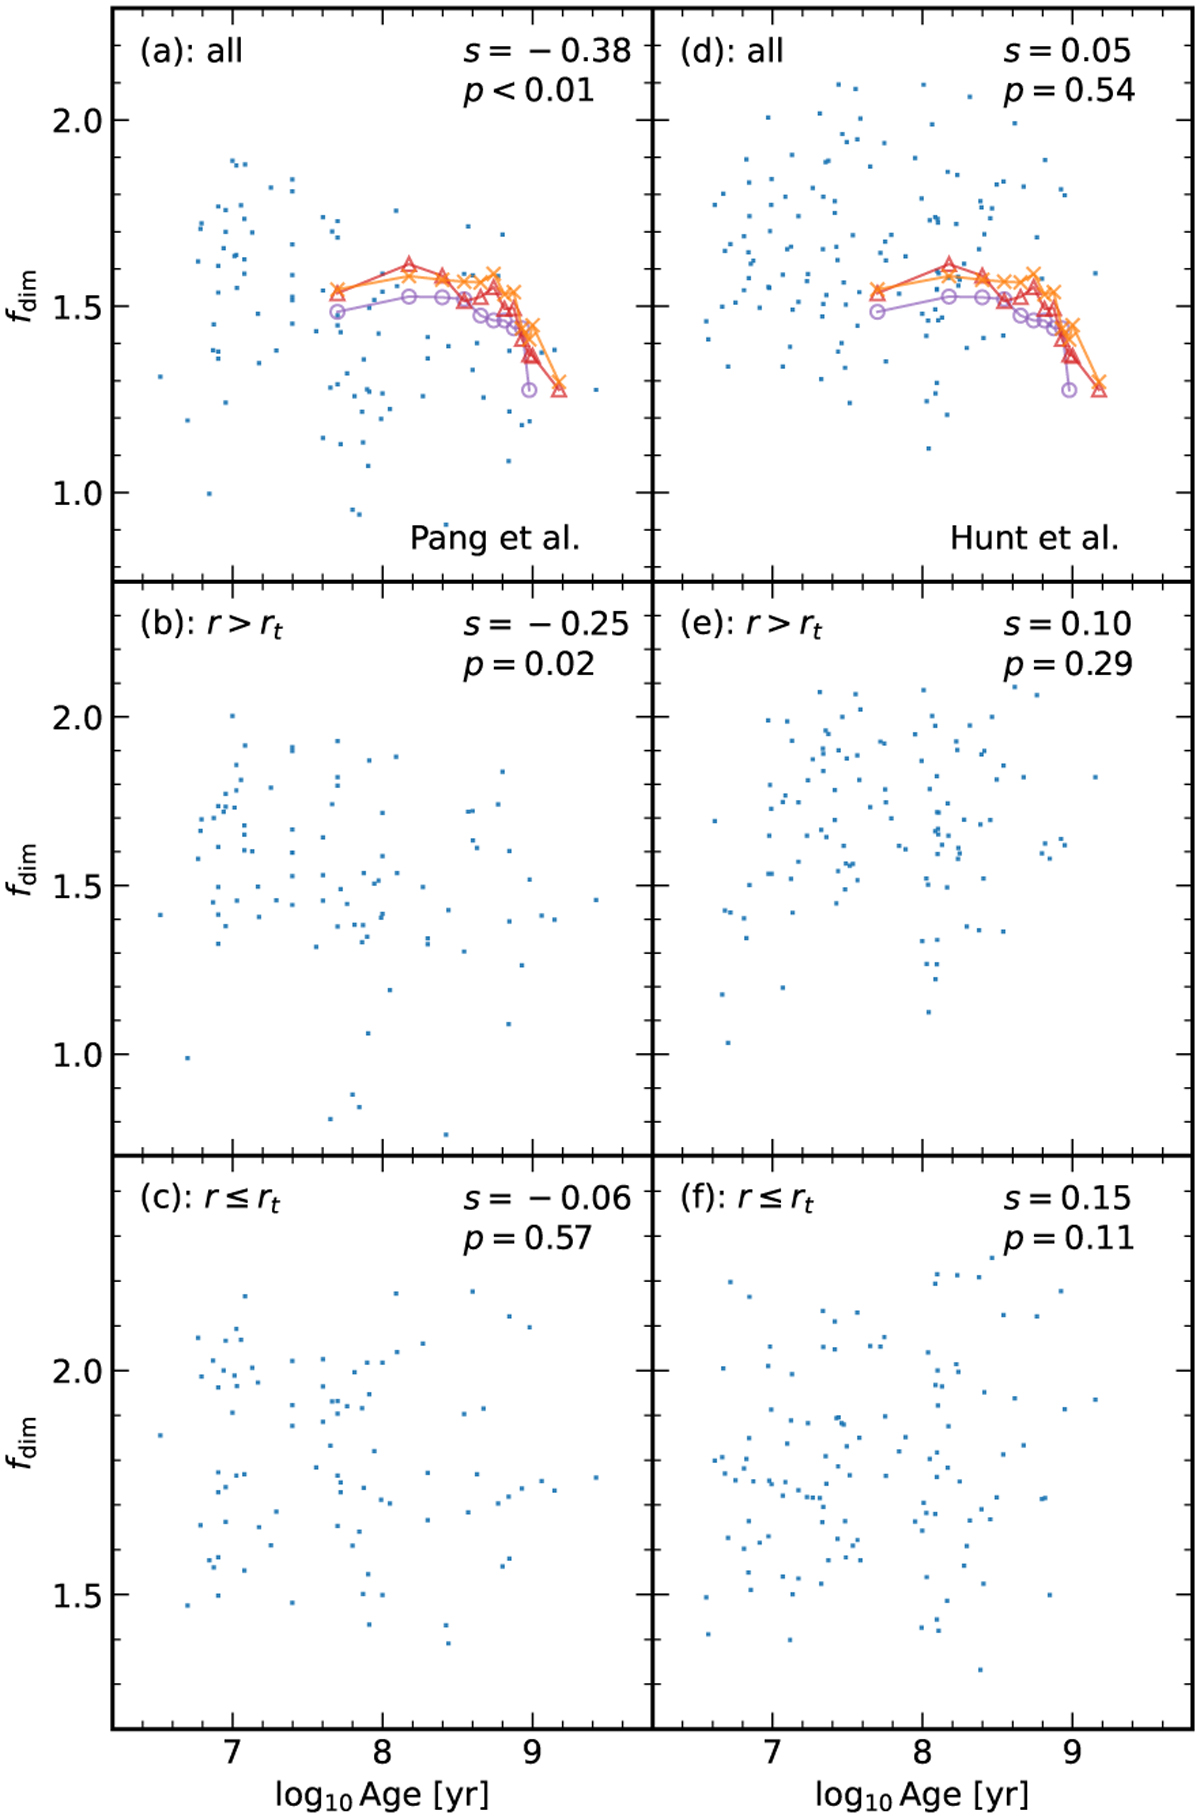
Fig. 7
Download original image
Relation between the fractal dimension and the cluster age in Pang catalog clusters (left panels) and in Hunt catalog clusters (right panels) in the solar neighborhood for the all-member region (a and d), r > rt (b and e), and r ≤ rt (c and f). The colored open symbols and curves in panels a and d represent the evolution of the fractal dimension taken from the simulations by Ussipov et al. (2024) with SFEs of 0.15 (purple circles), 0.17 (red triangles), and 0.20 (orange crosses). The quantity s is Spearman’s rank correlation coefficient, and p is the probability of the null hypothesis in the correlation test. A p-value less than 0.05 means rejection of the null hypothesis.
Current usage metrics show cumulative count of Article Views (full-text article views including HTML views, PDF and ePub downloads, according to the available data) and Abstracts Views on Vision4Press platform.
Data correspond to usage on the plateform after 2015. The current usage metrics is available 48-96 hours after online publication and is updated daily on week days.
Initial download of the metrics may take a while.