Fig. 5.
Download original image
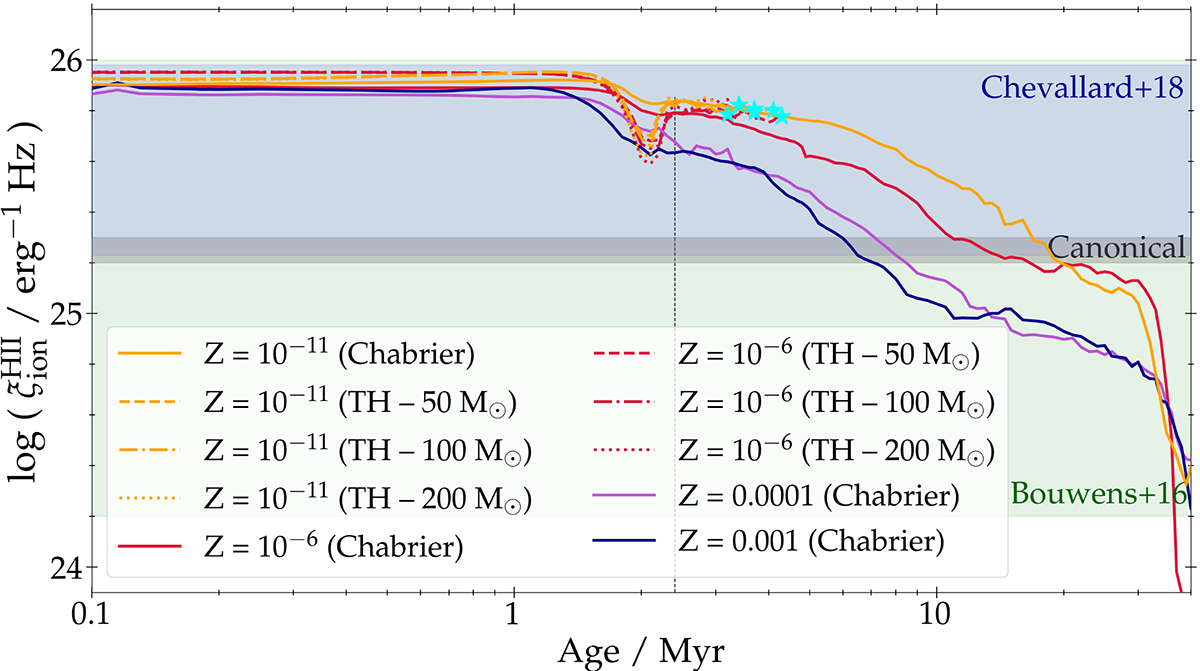
Nebular ionizing-photon production efficiency ![]() as a function of the stellar-population age for the same GALSEVN models as in Fig. 1. The time evolution is followed up to 40 Myr, but the H II regions surrounding the young stellar populations are expected to have been disrupted before at most 10 Myr (Murray 2011; Ma et al. 2015). The vertical dashed line marks the time of appearance the first SN in the lowest-metallicity models, corresponding to the beginning of chemical enrichment. The models with top-heavy IMFs are plotted until their absolute UV magnitude reaches MUV = −14, marked by cyan stars. The blue and green-shaded regions correspond to
as a function of the stellar-population age for the same GALSEVN models as in Fig. 1. The time evolution is followed up to 40 Myr, but the H II regions surrounding the young stellar populations are expected to have been disrupted before at most 10 Myr (Murray 2011; Ma et al. 2015). The vertical dashed line marks the time of appearance the first SN in the lowest-metallicity models, corresponding to the beginning of chemical enrichment. The models with top-heavy IMFs are plotted until their absolute UV magnitude reaches MUV = −14, marked by cyan stars. The blue and green-shaded regions correspond to ![]() constraints derived from observations at low to intermediate redshifts, from different works. The gray-shaded region corresponds to the canonical values usually adopted for
constraints derived from observations at low to intermediate redshifts, from different works. The gray-shaded region corresponds to the canonical values usually adopted for ![]() in simulations.
in simulations.
Current usage metrics show cumulative count of Article Views (full-text article views including HTML views, PDF and ePub downloads, according to the available data) and Abstracts Views on Vision4Press platform.
Data correspond to usage on the plateform after 2015. The current usage metrics is available 48-96 hours after online publication and is updated daily on week days.
Initial download of the metrics may take a while.