Fig. 4.
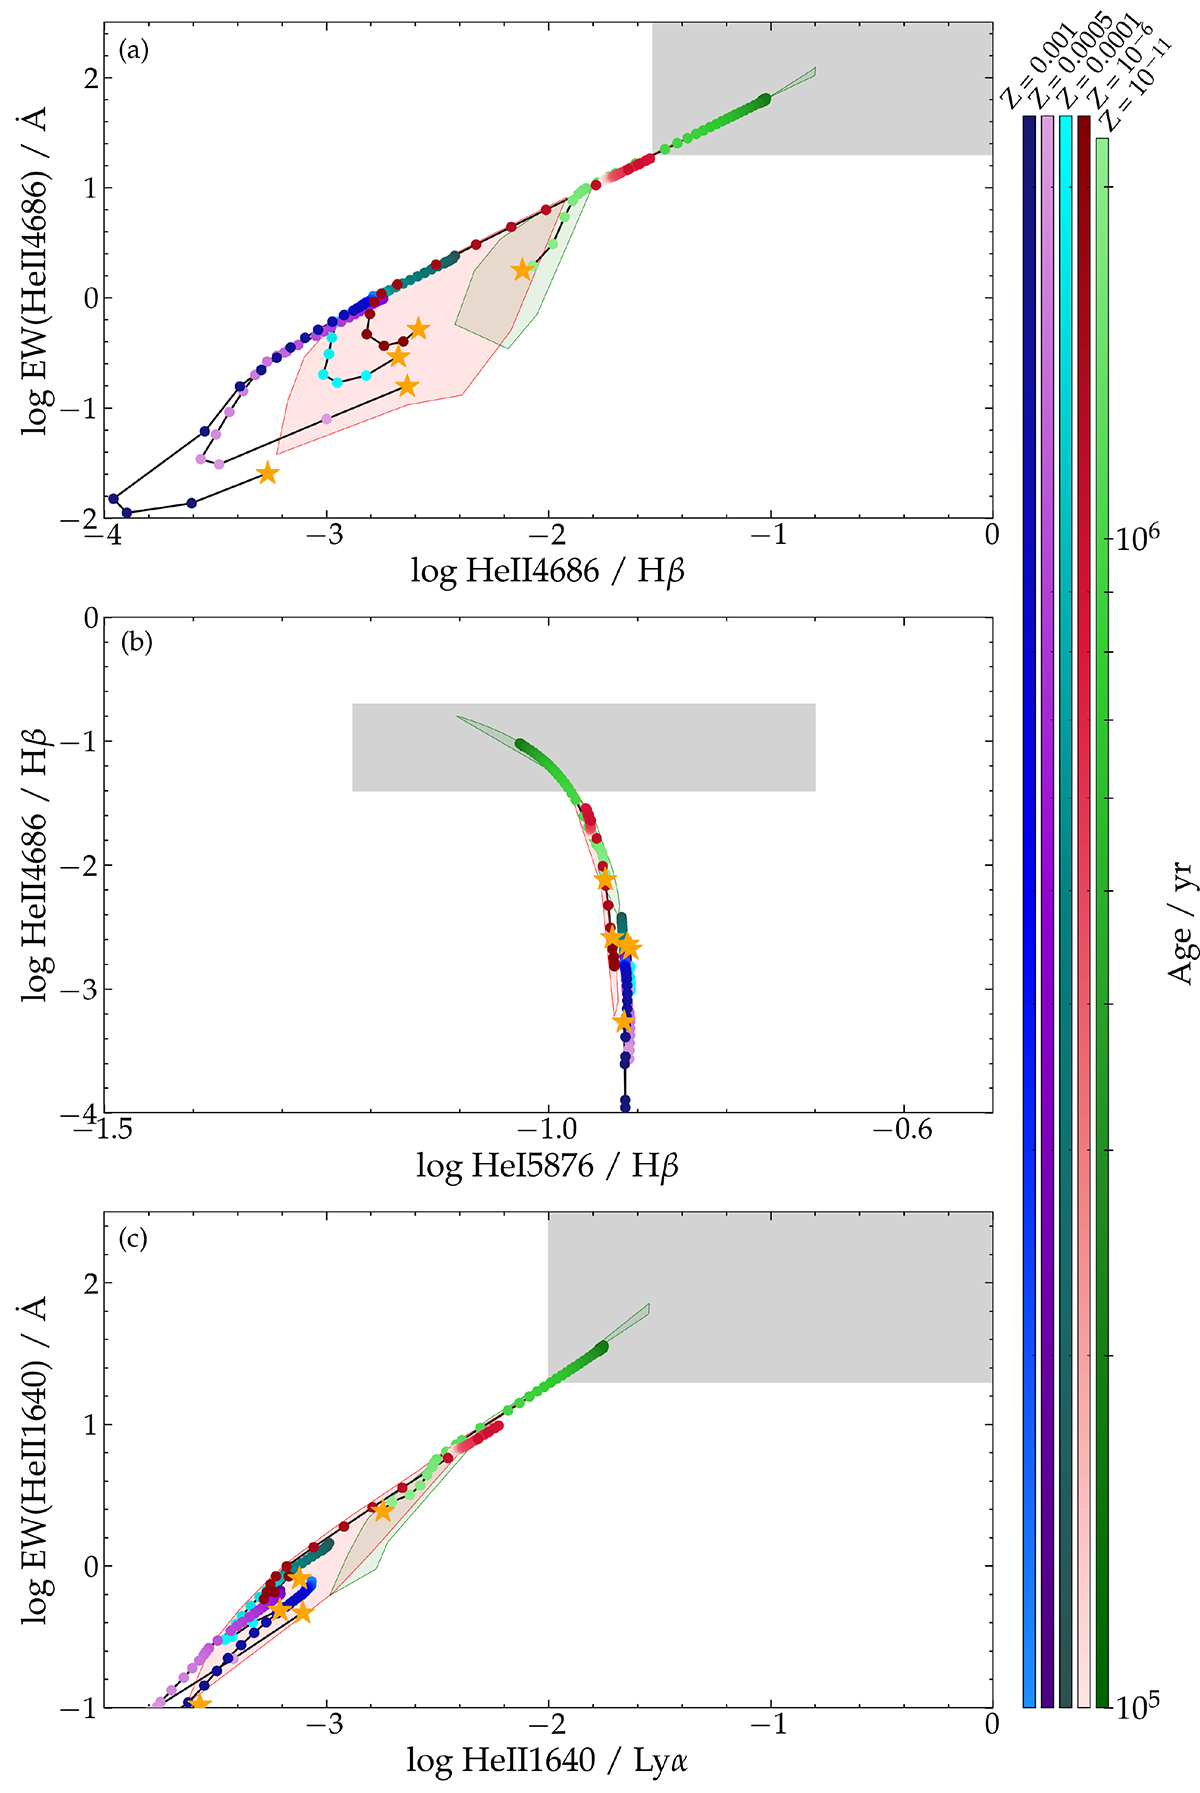
Download original image
Same diagnostic diagrams as in Fig. 3. As before, the gray-shaded zone in each diagram indicates the location of models powered by Pop III stars, as identified by Nakajima & Maiolino (2022). The different curves with dots show the temporal evolution of the GALSEVN SSP models presented at zero age in Fig. 3, with age referenced by the color bars on the right. For each curve, an orange star marks the appearance of the first SN, at which point the model is stopped in the present study. The red- and green-shaded regions show the areas covered by models with top-heavy IMFs, as in Figs. 1 and 2.
Figures 3 and 4 overall highlight the fact that the GALSEVN models support the criteria presented by Nakajima & Maiolino (2022) to identify ionization by Pop III stellar populations. The figures also confirm that these criteria as strict enough to efficiently separate Pop III signatures from those from other possible sources of high-energy photons. However, the high thresholds of these criteria make them accurate for only a very short time, making the probability of actually observing stellar populations in this regime very low.
Current usage metrics show cumulative count of Article Views (full-text article views including HTML views, PDF and ePub downloads, according to the available data) and Abstracts Views on Vision4Press platform.
Data correspond to usage on the plateform after 2015. The current usage metrics is available 48-96 hours after online publication and is updated daily on week days.
Initial download of the metrics may take a while.