Fig. 2.
Download original image
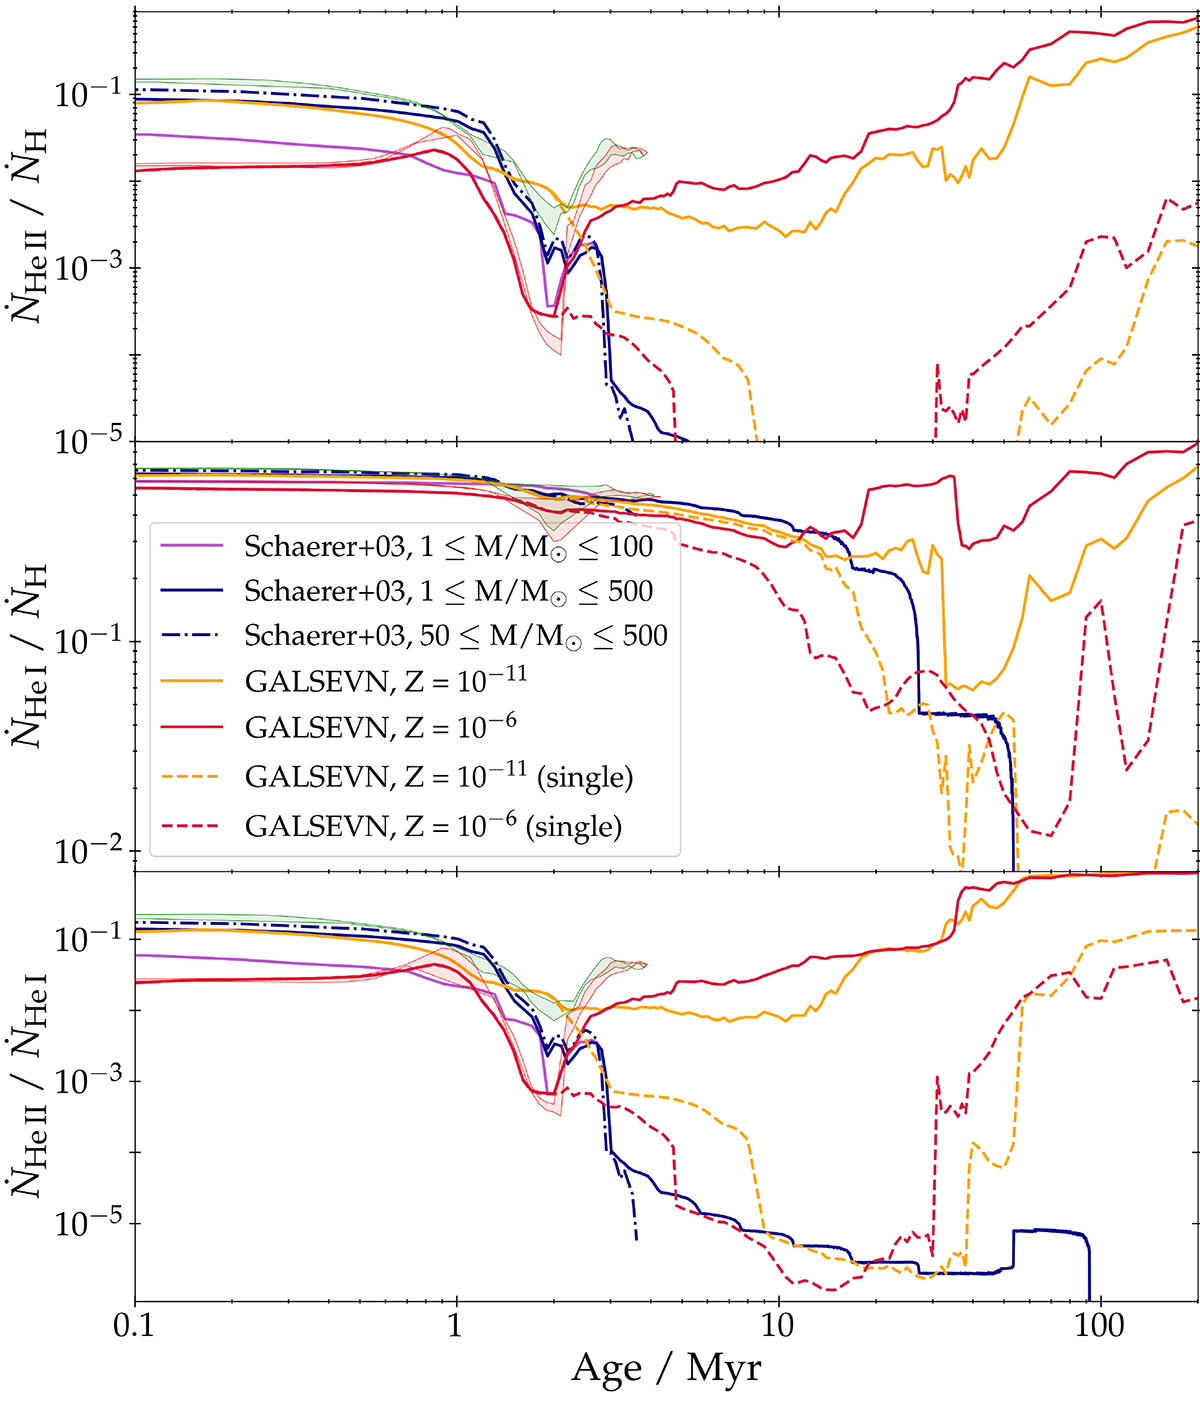
Same as Fig. 1, but comparing the prediction of GALSEVN and Schaerer (2003) Pop III models. The solid- and dashed-orange and red curves represent the same GALSEVN Z = 10−11 and 10−6 models as in Fig. 1, with a Chabrier (2003) IMF truncated at 0.1 and 300 M⊙ for primary stars, combined with a Sana et al. (2012) distribution of secondary-to-primary mass ratios at age zero (with single stars modeled as noninteracting binaries). The green- and red-shaded regions indicate the areas covered by models with the same three top-heavy IMFs with characteristic masses of 50 M⊙, 100 M⊙ and 200 M⊙ as in Fig. 1. The solid purple, solid blue and dot-dashed blue curves show the zero-metallicity, single-star models of Schaerer (2003) for three Salpeter (1955) IMFs with different lower- and upper-mass cut-offs.
Current usage metrics show cumulative count of Article Views (full-text article views including HTML views, PDF and ePub downloads, according to the available data) and Abstracts Views on Vision4Press platform.
Data correspond to usage on the plateform after 2015. The current usage metrics is available 48-96 hours after online publication and is updated daily on week days.
Initial download of the metrics may take a while.