Fig. 4.
Download original image
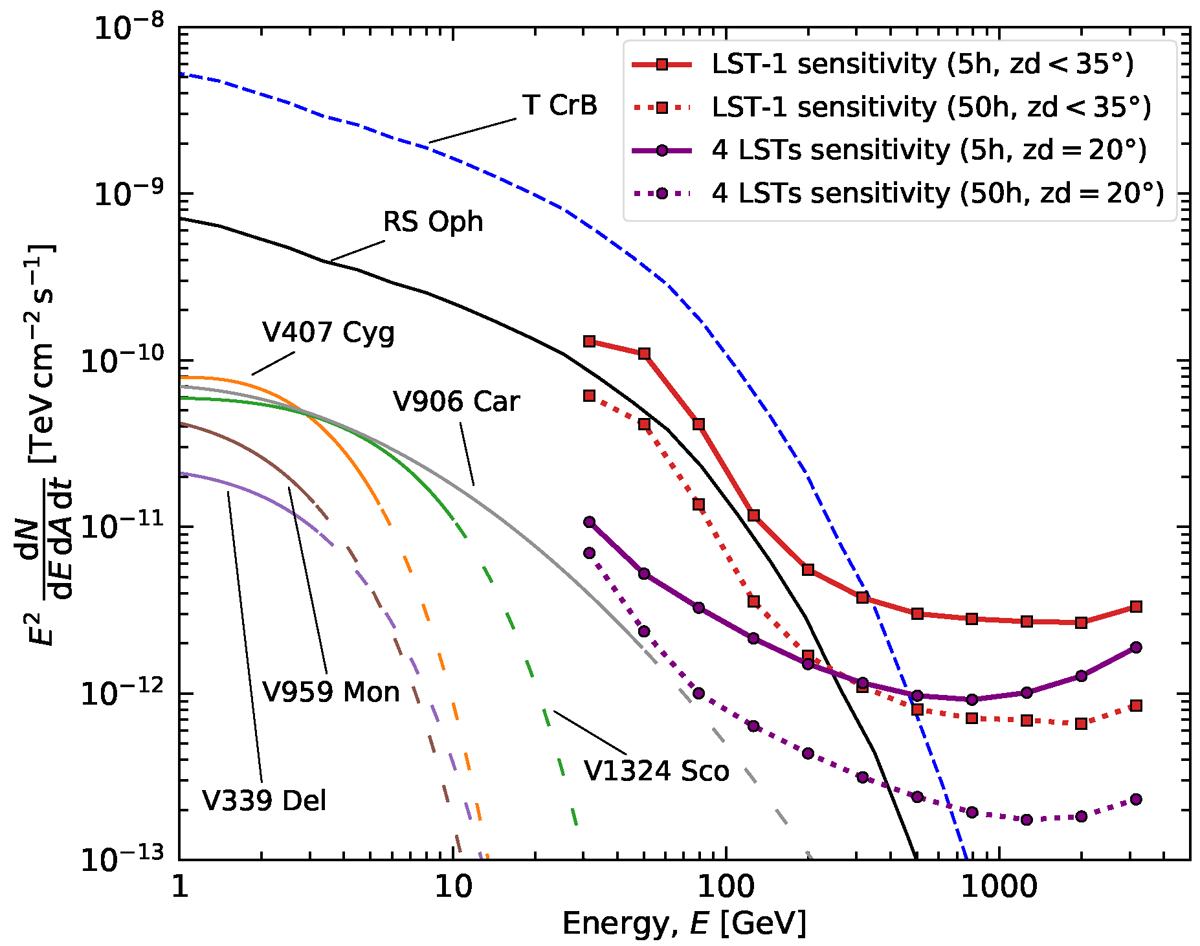
Best-fit SED models for RS Oph (black; this work, t − t0 ∼ 1 d), V906 Car (grey; Aydi et al. 2020), the first novae detected with Fermi-LAT (V407 Cyg, orange; V1324 Sco, green; V959 Mon, brown; V339 Del, pink; Ackermann et al. 2014), and the expected SED from T CrB (blue). The solid region of the nova SEDs approximately corresponds to the energy range where the model was fitted to the data, while the spaced-dashed region corresponds to the extrapolation region of the model. In addition, the sensitivity curves for LST-1 at low zenith angles (zd < 35 °; red square curves; Abe et al. 2023a) and the four LSTs of CTAO-North at zd = 20° (purple circle curves; using the latest Prod5-v0.1 IRFs in Cherenkov Telescope Array Observatory & Cherenkov Telescope Array Consortium 2021) for 5 and 50 hours of observation time (see text for details) are displayed as solid and dotted curves, respectively.
Current usage metrics show cumulative count of Article Views (full-text article views including HTML views, PDF and ePub downloads, according to the available data) and Abstracts Views on Vision4Press platform.
Data correspond to usage on the plateform after 2015. The current usage metrics is available 48-96 hours after online publication and is updated daily on week days.
Initial download of the metrics may take a while.