Fig. 4
Download original image
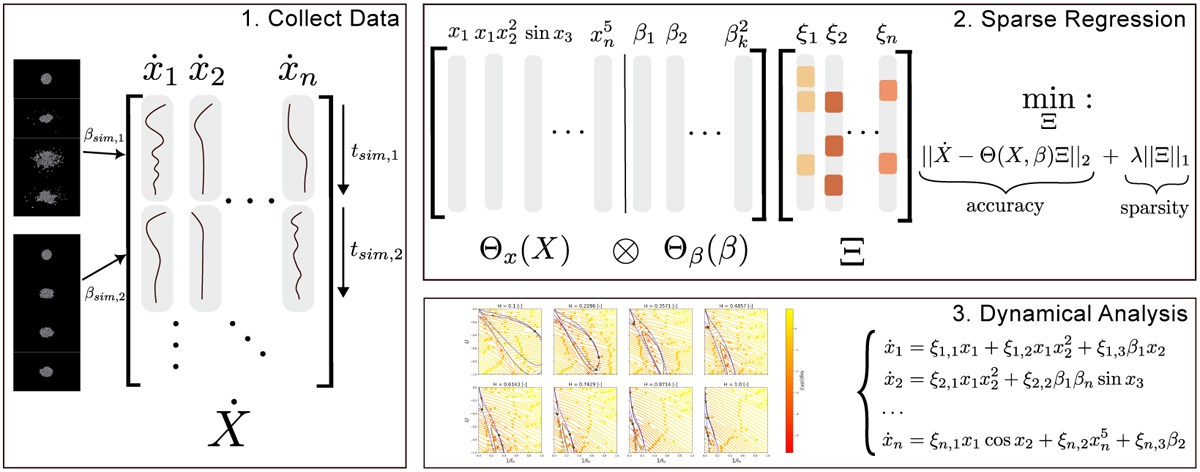
Schematic illustration of the SINDy algorithm. A numerical derivative of the data from different GRAINS simulation are taken and put into a large data matrix ![]() (left square). A function library, Θ, is created and a linear regression problem is solved to obtain the coefficient matrix Ξ, including a sparsity regularisation term (top right square). The found equations of motion are then analysed using dynamical systems theory (lower right square).
(left square). A function library, Θ, is created and a linear regression problem is solved to obtain the coefficient matrix Ξ, including a sparsity regularisation term (top right square). The found equations of motion are then analysed using dynamical systems theory (lower right square).
Current usage metrics show cumulative count of Article Views (full-text article views including HTML views, PDF and ePub downloads, according to the available data) and Abstracts Views on Vision4Press platform.
Data correspond to usage on the plateform after 2015. The current usage metrics is available 48-96 hours after online publication and is updated daily on week days.
Initial download of the metrics may take a while.