| Issue |
A&A
Volume 684, April 2024
|
|
|---|---|---|
| Article Number | A172 | |
| Number of page(s) | 12 | |
| Section | Planets and planetary systems | |
| DOI | https://doi.org/10.1051/0004-6361/202348112 | |
| Published online | 19 April 2024 | |
Regolith resurfacing and shedding on spinning spheroidal asteroids: Dependence on the surface mechanical properties
1
School of Aerospace Engineering, Tsinghua University,
Beijing
100084,
PR China
e-mail: This email address is being protected from spambots. You need JavaScript enabled to view it.
2
School of Aeronautic Science and Engineering, Beihang University,
Beijing
100191,
PR China
e-mail: This email address is being protected from spambots. You need JavaScript enabled to view it.
Received:
29
September
2023
Accepted:
29
January
2024
Abstract
Context. The Yarkovsky–O’Keefe–Radzievskii–Paddack (YORP) effect has been shown to effectively alter the rotational status of asteroids. The spin-up of the asteroid leads to surface instability and eventually triggers regolith failure, followed by landslide and mass shedding on the asteroid’s surface.
Aims. We explore the dynamics of the rotation-induced resurfacing and shedding, paying special attention to the dependence of post-shedding evolution on regolith mechanical properties, such as cohesion.
Methods. We propose a qualitative semi-analytical model to explore the post-failure dynamics of a fast-rotating asteroid. We also consider the interaction between the surface mass rearrangement and the asteroid’s spin status. We used our model to investigate the surface region where the failure occurs, as well as the total mass shed from the surface and the spin-down of the asteroid in this process.
Results. Based on our model, all the possible avalanche events following a regolith failure can be classified into four basic types: resurfacing (ReS), shedding and resurfacing (S&ReS), shed and bound (S-Bound), and shedding and escaping (S-Escp). Their corresponding regions in the parameter space are illustrated in this work. Our results show that although the regolith cohesion is very small (≲1–2 Pa), cohesion plays an important role in the onset of the avalanche. Moreover, our model qualitatively reconstructs the links between the regolith’s properties and the dynamical fates of the shed material. The timescale of YORP-induced shedding events is also discussed in this work.
Key words: minor planets, asteroids: general / planets and satellites: dynamical evolution and stability / planets and satellites: surfaces
© The Authors 2024
 Open Access article, published by EDP Sciences, under the terms of the Creative Commons Attribution License (https://creativecommons.org/licenses/by/4.0), which permits unrestricted use, distribution, and reproduction in any medium, provided the original work is properly cited.
This article is published in open access under the Subscribe to Open model. This email address is being protected from spambots. You need JavaScript enabled to view it. to support open access publication.
1 Introduction
Recent observations have revealed that the asteroid’s surface is more dynamical than previously considered. For example, OSIRIS-REx mission captured ongoing dust ejection on asteroid (101955) Bennu (Lauretta et al. 2019) in 2019. Moreover, the multiple dust tails of 311P/PANSTARRS and (6478) Gault have indicated numerous mass-shedding events happening on both of them (Jewitt et al. 2015; Chandler et al. 2019), as well as on many other active asteroids observed in recent decades (Jewitt 2012). Signs of resurfacing have also been discovered on asteroid (25143) Itokawa (Miyamoto et al. 2007). Therefore, to better understanding these observations requires further studies exploring the geological processes occurring on small bodies.
Several factors are believed to drive geological activities on the asteroid’s surface, such as impact, tidal deformation, thermal effects, and the YORP effects (DeMeo et al. 2023). The impacts construct craters on the asteroid surface, possibly even triggering a subsequent global refreshing of the surface (Richardson et al. 2005; Tang et al. 2023). As for the tidal effect, for the near-Earth asteroids, the tidal stress could trigger resurfacing during close encounters with Earth (Kim et al. 2023). The thermal cycle on asteroids is commonly with short period (roughly equal to the spin period) and broad temperature variations. The periodic disturbance induced by the thermal cycle would lead to particle rock breakdown (Delbo et al. 2014; Molaro et al. 2017), creeping movement (Divoux et al. 2008), and grain size sorting (Bovie et al. 2023) on the surface.
This work focuses on the Yarkovsky-O’Keefe-Radzievskii-Paddack (YORP) effect, which describes how the thermal emission from an irregularly shaped body produces a torque, causing changes in its rotational status, namely, the spin rate and obliquity (Rubincam 2000). Due to the YORP torque, an asteroid’s spin rate can increase over time. Traditionally, it is believed that the YORP spin-up could play an important role in the evolution of asteroids. If the spin rate becomes fast enough, the rotational instability of the asteroid could be triggered, inducing deformation and spin-down (Walsh et al. 2012; Walsh 2018; Cotto-Figueroa et al. 2015). Observation has confirmed the existence of a lower bound for an asteroid’s spin period, namely, ~2 h, for asteroids with a diameter greater than ~200 m (Jacobson et al. 2014). Using discrete element method (DEM) simulations, different deformation and disruption patterns have been investigated (Sánchez & Scheeres 2016; Zhang et al. 2021; Hu et al. 2021). Based on these simulation studies, Zhang et al. (2022) proposed that all these instability patterns may be described as combinations of four basic processes: landslide, internal deform, tensile disruption, and mass shedding.
We set our interests primarily on the surface activities triggered by the rotational instability. Therefore, only the landslide and mass shedding on the surface are considered here for simplicity. Britt & Consolmagno (2001) have suggested that the rubble pile asteroid can be modeled as a stronger interior containing large rocks and a weaker regolith layer covering it. The activities we explore in this work occur in this outer regolith layer. Following this model, Scheeres (2015) provided a semi-analytical investigation on the landslide and shedding on spherical asteroids under the assumption of cohesionless regolith. Subsequently, Sánchez & Scheeres (2020) analysed the failure modes of the cohesive regolith layer. Many fast-rotating asteroids are top-shaped, which Cheng et al. (2021) is explained to be the result of the rotational instability. Moreover, a number of the primary of binary asteroids systems are found to be top-shaped, fast rotating, and fragile (Sánchez & Scheeres 2014; Minker & Carry 2023). This may indicate a secondary forming from the prior YORP-induced mass shedding (Walsh et al. 2008; Hyodo & Sugiura 2022).
The DEM simulation provides a powerful tool to explore the dynamical process of surface activities (Hestroffer et al. 2019). However, the huge computational cost makes it hard to fully reveal the multi-parameter dependence across a relatively wide parameter range purely via a numerical simulation. Another approach adopted in this work involves constructing simplified models that qualitatively describe the most essential mechanisms. While this approach is not as accurate as DEM simulations, sufficiently simplified models enable the analysis of the multi-dimensional parameter dependencies, which could offer a good overall understanding and reveal new clues for numerical studies.
In this work, we propose a qualitative semi-analytical model to investigate the dynamics of the regolith landslide and mass shedding on asteroids. The interaction between the surface mass movements and the spin state changes is incorporated in our model. Moreover, a classification of the YORP-induced avalanche events and the influence of the regolith cohesion are explored in our analysis. The outline of this paper is as follows. In Sect. 2, the mechanical failure conditions of the surface regolith are derived. In Sect. 3, we present our semi-analytical model and results. A discussion are given in Sect. 4. Finally, our conclusions are presented in Sect. 5.
2 Mechanical failure condition of the regolith
2.1 Two-layer spheroid model of the asteroid
Most asteroids are believed to be rubble piles, composed of a large number of solid fragments by gravitational or other interactions (Zhang & Michel 2021). Though there is no direct evidence revealing the true interior of rubble pile asteroids, many previous researches suggest the heterogeneity of rubble pile interior (Lowry et al. 2014; Tricarico et al. 2021; Bierhaus et al. 2023). Applying a shell-core model is one of the most minimal approaches to model this heterogeneity (Zhang et al. 2022; Sánchez & Scheeres 2018; Hirabayashi et al. 2015). Since recent mission and observation have revealed the presence of a weak surface on asteroids (Walsh et al. 2022; Jackson et al. 2022), a relatively cohesive core covered by a layer of low cohesion regolith is capable of representing an interior that is applicable for a large number of asteroids.
Our theoretical investigation is aimed at obtaining a qualitative picture of what occurs during a rotational failure and the subsequent avalanche. Hence, the model presented in this work is intended to be straightforward. We assume that the asteroid is a uniformly rotating, self-gravitating spheroid. Following Sánchez & Scheeres (2020), we adopted a two-layer internal structure model to proceed with our qualitative investigation. In this model, the asteroid is composed of a spherical core and a loose regolith layer covering it (Fig. 1).
The total radius and the gravitational constant are denoted as R and G. The bulk density of the core and the regolith layer are set to the same value, denoted as ρ. Following Hirabayashi et al. (2015), we normalised the lengths, body forces and accelerations, angular velocities, and stress tensors by  and πρ2GR2, respectively. In addition, we denote the thickness of regolith layer as Hreg, thus, the radius of the internal core is Rc = 1 − Hreg. Figure 1 shows that the spin axis is assumed to be constant along the z axis.
These two layers have different mechanical properties. Specifically, the core is set to be strong enough that the deformation of the core is precluded in situations considered. Therefore, only deformation and mass movement in the surface regolith layer will occur. Importantly, ‘rigid core’ or ‘strong core’ only indicates that the core possesses enough cohesion to ensure the surface layer to fail first as the spin rate increases, rather than that the core is strong as monolithic rocks (Sánchez & Scheeres 2018; Hirabayashi et al. 2015).
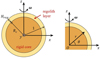 |
Fig. 1 Spheroid model with an internal core covered by loose regolith layer. The total radius is normalised to 1. |
2.2 Failure of the regolith layer
The rubble pile structure indicates that the asteroid can be treated as a bound granular system, which can be numerically studied using the DEM simulation (Cheng et al. 2023). Another approach is to assume the rubble pile is made up of ideal continuous geomaterial that is elastic-perfectly plastic (Holsapple 2008). To analytically investigated the failure condition of regolith layer, the geomaterial assumption is adopted in this section.
2.2.1 Failure criterion for the geomaterial
The failure criterion of the granular geomaterial is assumed to follow the Drucker-Prager yield criterion, which is given by:
 (1)
(1)
where I1 is the first invariant of the Cauchy stress tensor, J2 is the second invariant of the deviatoric stress tensor, and α and s are functions of the material parameters. Denoting the principal stresses as σ1, σ2, and σ3 (from the largest to the smallest), we then have I1 = σ1 + σ2 + σ3 and J2 =[( σ1 − σ2)2 + (σ2 − σ3)2 + (σ3 − σ1)2]/6. Given the internal friction angle ϕ and the yield strength C of the material, parameters α and s are:
 (2)
(2)
The Drucker–Prager yield criterion is widely applied to describe the failure modes of the pressure-dependent geoma-terial, namely, the regolith material in this work. The yield strength, C, appearing in the criterion represents the macroscopic cohesive strength (Zhang et al. 2018) and thus differs from the inter-particle cohesion c in DEM formulation. Setting the ‘≤’ as ‘=’ in Eq. (1), the dynamical cohesion is:
 (3)
(3)
which gives the minimum local bulk cohesion needed to avoid failure. The dynamical cohesion is a reliable indicator of material failure. The failure would occur when the local dynamical cohesion, C*, exceeds the macroscopic cohesive strength, C.
2.2.2 Estimation of the critical spin rate
The stress solution of this spheroid can be solved from the elastic equations and the Hooke’s law with proper boundary condition Dobrovolskis (1982):
 (4)
(4)
where n is the outward normal vector on the surface of the spheroid, and r2 = x2 + y2 + z2. The solution is (Hirabayashi 2015; Hirabayashi et al. 2015):
 (5)
(5)
 (6)
(6)
 (7)
(7)
 (8)
(8)
 (9)
(9)
 (10)
(10)
where the coefficients are defined as:
 (11)
(11)
 (12)
(12)
 (13)
(13)
 (14)
(14)
Here, v is the Poisson’s ratio of the material.
Due to the microscopic heterogeneous nature of the granular assembly, the actual failure occurring in the granular material is more complex than in the homogeneous elastic-perfectly plastic material. Given the elastic stress solution for the spherical rubble pile asteroids, we can determine the range of the critical spin rate at which the actual failure occurs. The upper and lower bound conditions of the actual failure can be determined by applying the theorems from the structural limit analysis (Chen & Liu 1990).
The lower bound theorem states that the actual critical spin rate is greater than a special spin rate value ω(−), at which the largest C* in the considered volume, V is exactly the cohesion strength, C. Hence, ω(−) is a lower bound of critical spin. Setting FV(ω, ϕ) = maxr∈V C*(r; ω, ϕ), ω(−) is obtained by solving the following equation:
 (15)
(15)
Likewise, the upper bound of critical spin rate can be determined by applying the upper bound theorem. Based on this theorem, Holsapple (2008) proved the following conclusion: assuming the velocity field is linear for a given volume when failure happens, the yield condition of the averaged stress is equal to an upper bound on the actual critical spin rate (denoted as ω(+)). The averaged principal stress over a given volume, V, is defined as
 (16)
(16)
Hirabayashi et al. (2015) derived the averaged principal stresses for the volume of Rc ≤ r ≤ 1 (the regolith layer), given as
 (17)
(17)
 (18)
(18)
where  . Based on Eq. (3), the upper bound ω(+) can be obtained from:
 (19)
(19)
where J2 and I1 are functions of the principal stresses.
The upper bound, ω(+), and lower bound, ω(−), depend on the material mechanical properties: Poisson’s ratio, v, the internal friction angle, ϕ, and the macroscopic cohesive strength, C. The internal friction angle is typically in the range from ~25º to ~45º, and the DEM simulations suggest a Poisson’s ratio of ~0.2 for such granular media (Brisset et al. 2022). This work focuses primarily on the dependence of the failure and the subsequent evolution to the regolith cohesion C. In the following, the Poisson’s ratio is fixed at 0.25, and the friction angle values of 30º, 40º, and 50º are examined.
The estimations of the critical spin rate are presented in Fig. 2. Given Hreg and ϕ, the critical spin rate generally increase with the cohesion, C. Thicker regolith layer leads to higher ω(+) and ω(−). However, the influence of ϕ to ω(+) and ω(−) seems more subtle and it is not a primary focus in this work. Furthermore, the condition of mass shedding is evident from Fig. 2. If the critical spin rate, ωc, is higher than  mass shedding occurs. In contrast, if ωc ≤ ωshed, mass shedding will not occur. Therefore, if the upper bound ω(+) is lower than ωshed, no mass shedding will occur (denoted as N in Fig. 2); if ω(−) < ωshed < ω(+), mass shedding is possible (denoted as PMS in Fig. 2); if the lower bound ω(−) is higher than ωshed, it is certain that mass shedding will happen (denoted as MS in Fig. 2).
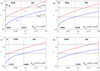 |
Fig. 2 Upper bound and lower bound of critical spin rate as the function of regolith cohesive strength C. (a−c) The friction angle is ϕ = 30° and the regolith thickness vavies from Hreg → 0 to Hreg = 0.10. (b) The friction angle is set to be a larger value ϕ = 40° and the thickness of the regolith is Hreg = 0.05. N: no mass shedding; PMS: possible mass shedding; and MS: mass shedding. |
2.2.3 Failure modes of the regolith layer
Figure 3 shows the distribution of dynamical cohesion, C*, in a regolith layer with a thickness of Hreg = 0.1. It is shown that the maximum dynamical cohesion  increases as the spin rate increases, indicating that the critical spin rate is higher for stronger regolith. For any non-zero spin rate, the location of the maximum dynamical cohesion is in the equator region, near θ = 0. However, beyond a certain spin rate, ωt, the maximum point shifts from the surface (r = l) to the regolith-core interface (r = 1 − Hreg). For Hreg = 0.1 and ϕ = 30°, the value of ωt is approximately 1.1.
Halsey & Levine (1998) found that for cohesionless granular media, such as dry sand, the failure and subsequent dynamical process are confined to a thin near-surface layer. The existence of cohesion causes the failure site move from the surface into the bulk of the sand pile, leading to more violent avalanche to follow. This conclusion aligns with the trend shown in Fig. 3. Moreover, due to the positive correlation between the critical spin rate ωc and the cohesion (Fig. 2), the actual critical spin rate ωc could exceed ωt. In this case, the failure initiates deep in the regolith layer, and the subsequent deformation of the failed zone is more catastrophic compared to surface-initiated failures.
As stated in Hirabayashi et al. (2015), the deformation mode of regolith layer also depends on the thickness of regolith layer (denoted as Hreg). Specifically, when Hreg = 1, the deformation mode would be global distortion or even catastrophic disintegration (Zhang et al. 2022). In general, a larger Hreg leads to greater and more widespread deformation. In addition, Ferrari & Tanga (2022) suggested that the presence of a rigid core is critical in surface rearrangement and the occurrence of mass shedding. The rotational instability is believed to trigger the shedding events on the asteroids 311P/PANSTARRS and (6478) Gault (Jewitt et al. 2018; Chandler et al. 2019). Observations of these two active asteroids have confirmed that the total mass of shed material is very small compared with the mass of the asteroid. This indicates that the regolith layer involved is thin (Jewitt et al. 2015, 2019). Hence, we assume that the regolith layer is thin enough (Hreg ≪ 1). Under this assumption, global deformation can be ignored herein. Additionally, the changing of total shape from surface failure with following gravitation changing are assumed to be ignorable to avoid their complex interaction.
3 Semi-analytical model of the resurfacing and shedding
In this section, we describe the construction of a semi-analytical model to qualitatively explain the resurfacing and shedding process following the regolith failure. Previous research (Hirabayashi et al. 2015; Zhang et al. 2022; Song et al. 2023) has revealed that this process is influenced by complex interactions involving the surface mass movement, rotation status of the asteroid, shape of the asteroid, gravitation, and so on. As mentioned in Sect. 2, the asteroid is assumed to be a spheroid with a thin enough regolith. Therefore, only the surface mass movement, rotation status, and their interaction are considered in our model.
3.1 Failure region and mobilised regolith
3.1.1 Failure region
As discussed above, failure in the regolith layer is induced when the spin rate exceeds a critical value, ωc. The failure occurring in the regolith layer leads to the mobilisation of the regolith material, following by an avalanche-like process. The mobilised material will move on the surface or be lofted from the surface (mass shedding) in the avalanche. Clearly, determining the total mass of the mobilised regolith is important for analysing the subsequent process. In what follows, we estimate this total mass based on the aforementioned failure mechanism.
As pointed out by Hirabayashi et al. (2015), the failure event starts from internal weak points in the regolith layer, where the microscopic granular structure is weaker than in the other region. When the spin rate increases to ωc, the failure region expand from the initial weak points with a finite speed, followed by a deformation in the failure region. Due to the conservation of the asteroid’s angular momentum (Sect. 3.2), the deformation of the regolith layer in failure region slows down the asteroid’s spin, diminishing the dynamical cohesion in other region. As a result, not all of the region where C* ≥ C at the critical spin rate would end up failing; hence, we can see that the failure region is local and not symmetric in terms of longitude (Fig. 4a).
For simplicity, the aforementioned effect is not considered in our model, and the regolith failure is assumed to occur at all the regions where the static failure condition C* ≥ C is satisfied when ω = ωc. Because the regolith shell is thin, the material failure occurring in the region where C* ≥ C scarcely affects the surrounding regions, where the failure condition is not met. Hence, it is reasonable to assumed that the regolith failure is confined to local regions, occurring only where C* ≥ C at the critical spin rate. As shown in Fig. 4b, the regolith failure occurs in a low-latitude region that is symmetric in terms of longitude. This serves as an estimation for the upper bound of failure region for a thin regolith layer (Hreg ≪ 1) at the given critical spin rate.
Based on the assumptions above, the failure region and the total mass of the mobilised regolith material can be estimated. To determine whether the failure condition is satisfied in a specific latitude θ, it is useful to define:
 (20)
(20)
where C*(r, θ; ωc) indicates the dynamical cohesion, C*, at (r, θ) under the critical spin rate, ωc. The failure is assumed to occur at the latitude θ if Cm(θ, ωc) ≥ C. We denote the maximum latitude of the failure region (FR) as θFR, all the material within FR = {(r,θ)|1 − Hreg ≤ r ≤ 1, − θFR ≤ θ ≤ θFR} is mobilised. Because Cm decreases with the latitude (as shown in Fig. 3), θFR can be obtained by solving the following equation:
 (21)
(21)
Although the actual critical spin rate cannot be obtained in our model, the upper and lower bounds of the critical spin rate (ω(+) and ω(−)) have been estimated. Considering the critical spin rate ωc as a variable defined in the interval [ω(−),ω(+)], the FR boundary latitude, θFR, is a function of ωc. As Fig. 5 shows, when ωc exceeds ω(−), the failure region begins expanding from the equator area; this is consistent with the C* distribution in Fig. 3. Therefore, θFR increases with ωc, and the upper bound of θFR (denoted as  ) is reached when ωc = ω(+). Larger failure regions mobilise more regolith material and, correspondingly, the dynamical effects of the post-failure avalanche are more significant.
The qualitative investigation in this work aims to show the dynamical effects of the rotational instability. With this taken into consideration, the aforementioned upper bound,  , provides an appropriate approximation of θFR for our qualitative investigation to show the dynamical effects of the rotational instability. After setting ωc = ω(+), solving Eq. (21) gives the estimation of the upper bound the failure region boundary latitude
  , as per:
 (22)
(22)
According to aforementioned reasons, we set ωc = ω(+) and  for simplicity in the following theoretical investigation. Figure 6a shows that θFR falls in a relatively narrow range from ~40° to ~60° for given ϕ, Hreg, and C values.
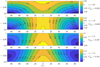 |
Fig. 3 Dynamical cohesion, C*, distribution in a Hreg = 0.1 regolith layer under different spin rates and the friction angle is set to be 30°. The maximum C* in the layer is denoted as |

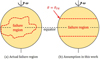 |
Fig. 4 Actual failure region in the regolith layer, which is local and not symmetric in longitude (a). The failure region considered in this work is assumed to be symmetric in both longitude and latitude (b), which is −θFR ≤ θ ≤ θFR. |
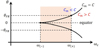 |
Fig. 5 Determination of θ R. |
3.1.2 The mass of mobilised regolith
Because the regolith layer is thin enough, it is reasonable to assume the following: at the given spin rate ω > ω(−), in the position (r, θ) in the regolith layer, if C*(r, θ) ≥ C, all the regolith (1 − Hreg ≤ r ≤ 1) would be mobilised at a latitude θ. This assumption provides an upper bound of the mobilised mass. Due to the same reason, supposing  , this mass upper bound is a qualitatively appropriate approximation for the total mobilised mass, denoted as mF. Since Hreg ≪ 1, then mF is given by
 (23)
(23)
where the mass is normalised by πρR3. As shown in Fig. 6b, with the thickness Hreg given, we find that mF is in a relatively narrow interval. With the failure region and corresponding regolith mass estimated, we go on to investigate the avalanche process and its effect on the asteroid rotation.
3.2 Interaction between the mass movement and the asteroid’s rotation
The timescale of an avalanche event is approximately several spin periods, while the timescale of YORP spin-up is believed to be far longer (Cotto-Figueroa et al. 2015; Scheeres 2007). Consequently, the effect of YORP torque during the post-failure avalanche can be ignored and it is reasonable to assume that the total angular momentum of the system (the asteroid + the lofted material) is conserved during the avalanche. Therefore, we have:
 (24)
(24)
during the post-failure evolution, where I is asteroid’s moment of inertia and Lshed is the angular momentum of the shed material.
When the mass shedding does not occur namely, ω ≤ ωshed, we have dLshed = 0. As the mobilised regolith moves downslope to the equator region, the moment of inertia, I, of the asteroid increases, causing the spin rate to decrease. Previous simulations have shown that the surface movement is sensitive to the mechanical properties and morphology of the asteroid (Cheng et al. 2021; Zhang et al. 2022; Song et al. 2023), hence, it is beyond the scope of this work to investigate the actual surface movement.
To simplify the analysis and avoid considering the complexity of actual surface movement, we assume that all the failure-mobilised material is finally transported to the equator, θ = 0, in a finite time during the avalanche. In this case of ω ≤ ωshed, no mass shedding would happen and ultimately all the mobilised material (the total mass is mF) is deposited on the equator.
The asteroid’s moment of inertia before the avalanche is I0 = 8/15, which is normalised by πρR5. The moment of inertia of mobilised regolith before the avalanche is given by:
 (25)
(25)
and after the avalanche, we have:
 (26)
(26)
We denote the final spin rate as ωfinal. Considering the conservation of angular momentum (Eq. (24)), we get
 (27)
(27)
Hence, the final spin rate after the avalanche is
 (28)
(28)
Equation (28) shows that the resurfacing following the rotational failure leads to the spin-down of the asteroid.
3.3 Dynamics of mass shedding
3.3.1 Complex nature of mass shedding
In the case of ωc > ωshed, mass shedding occurs during the avalanche. This means some of the mobilised regolith would be shed from the asteroid. The dynamics of the lofted material is governed by the gravitation (usually complex), shape (usually irregular), and surface mechanical properties of the asteroid, which can all contribute to its complex behavior (Sicardy et al. 2019; Yu et al. 2019).
A full consideration of the complex nature of mass shedding is beyond the scope of this work. Thus, we construct a simplified model to qualitatively describe the landslide and mass shedding, with a focus on demonstrating the angular momentum transport between the asteroid and the mobilised regolith. This approach allows us to explore the fundamental mechanisms governing the post-failure process, without delving into the detailed complexities of the mass shedding dynamics.
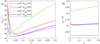 |
Fig. 6 Result of (a) the latitude boundary of failure region θFR and (b) the ratio of the mobilised mass, mF, in the asteroid’s total mass, M. |
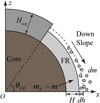 |
Fig. 7 Simplified model of surface mass movement. Here, we have H = Hreg − h, where h indicates the depth of regolith deposits that has been moved thus far. The failure region is −θFR < θ < θFR, denoted as FR in the figure. The newly moved regolith mass is dm = 4 sin θFRdh and it is originally located in the depth h to h + dh. |
3.3.2 Location of shedding
The regolith particles are lofted from different locations on the surface during mass shedding. However, after series of inelastic collisions with the surface, the particles’ mechanical energy decreases; thus, there is a common trend seen in their movement (Song et al. 2023). Most of their journeys finally end near the equator, and there are two fates awaiting them: being deposited in the near-equator region or entering a non-return orbit from the equator region.
For the first fate, the lofted particles finally return to the surface and it actually turns out not to be shedding from the asteroid in the end. It is only through the second fate that the particle enters into an orbit that does not return to the surface (at least not for a long time) and is eventually shed off. For simplicity, in the case of ω > ωshed, the first fate is not considered, and we assume that all the mobilised material finally accumulates near the equator and is then shed off.
The moment of inertia of the asteroid, I, decreases during the shedding process. At a given time, t, in the avalanche process, we assume that a regolith layer of thickness, H, remains in FR and the material that was originally located at Rc + H ≤ r ≤ 1 in FR (the mass is denoted as m) has been moved to a time, t. As shown in Fig. 7, we define the erosion depth h as h = Hreg − H, and the mass of the newly moved regolith in an infinitesimal time interval t ~ t + dt is given by:
 (29)
(29)
The increment of moved mass dm is assumed to migrate downs-lope toward the equator and then be shed in the time interval t ~ t + dt. The corresponding change for I in this interval is
 (30)
(30)
Therefore, when a layer of regolith of the depth h has been removed from FR, the moment of inertia is:
 (31)
(31)
3.3.3 Angular momentum carried by the shed material
In the shedding process (ω > ωshed), the failure-mobilised materiel is removed layer by layer from FR, transported to the equator, and, finally, shed from the surface on the equator. During this process, the moment of inertia decreases, and some angular momentum is carried by the shed material, which is the dLshed term in Eq. (24). Considering the moment when the shed material dm is lofted on the equator, we have:
 (32)
(32)
where vt is the tangential velocity component of the shed material, dm, in the equatorial plane. We notice that the velocity and the angular momentum are normalised by  and
and  respectively. Hence, estimating the value of dLshed requires us to estimate the velocity of the shed material when it is just shed from the equator.
The velocity, vt, is should exceed the shedding velocity  . On a macroscopic level, the asteroid’s angular momentum increases due to the YORP torque, leading to a rising spin rate. However, the excessive spin would cause structural failure and trigger avalanche processes. Through resurfacing and shedding, the system’s angular momentum is redistributed, resulting in the spin-down of the asteroid. Thus, the mass shedding would be expected to cause the spin-down (rather than spin-up) of the asteroid. As the shed material migrates to the equator, its angular momentum is expected to increase. Consequently, during this transportation, the tangential velocity should remain below the local surface velocity vlocal = ω cos θ. Hence, in the moment of shedding, we have vt ≤ ω. Additionally, combining Eqs. (24), (30), and (32) gives:
![Mathematical equation: $I{\rm{d}}\omega = - \left[ {{v_t} - \left( {1 - {1 \over 3}{{\sin }^2}{\theta _{{\rm{FR}}}}} \right)\omega } \right]{\rm{d}}m.$](/articles/aa/full_html/2024/04/aa48112-23/aa48112-23-eq46.png) (33)
(33)
This relation shows that the spin rate decreases with the mass of shed material, requiring that
 (34)
(34)
As Eq. (33) shows, a higher shedding velocity, vt, causes that more spin-down is induced by the shedding of dm. Either way, for larger vt, more angular momentum is carried away by the shed material, which means that the interaction between the moved material (shed off in the end) and the asteroid body is effectively more substantial. For simplicity, we assume that this interaction (through the friction and the collision) is sufficient. Hence, we take vt = ω, meaning that the relative velocity of the shed material to the asteroid’s surface is zero in the shedding moment. Therefore, the angular momentum carried by the shed material dm is dLshed = ωdm, then combining this with Eq. (33) gives:
 (35)
(35)
3.4 Category of the failure events
A simplified model of the avalanche process following the rotational failure has been constructed. The interaction between the asteroid body and the failure-mobilised regolith is phe-nomenologically incorporated. As shown, different material and structure parameters lead to varied dynamical processes and outcomes during the avalanche. In this section, four basic types of failure events are given, each corresponding to specific parameter ranges.
3.4.1 Type 1: Resurfacing (ReS)
If the critical spin rate, ωc, is less than the shedding spin rate,  no failure-mobilised regolith is shed off. We define this situation as resurfacing (ReS, type 1). In this case, with no mass shedding, the mobilised regolith is transported to the equator, inducing resurfacing and spin-down of the asteroid (see Sect. 3.2). The final spin rate after avalanche is given by Eq. (28). Additionally, since the mobilised regolith is finally deposited in the equator region, it is a persuasive argument to support the formation of a equatorial ridge in the avalanche (Cheng et al. 2021).
3.4.2 Type 2: Shedding and resurfacing (S&ReS)
In the case where ωc > ωshed, regolith shedding occurs during the avalanche. However, if the critical spin rate is not high enough1, only some of the mobilised regolith is shed, while the rest is deposited at the equator. This is due to that the asteroid’s spin rate drops below the shedding spin rate ωshed during the avalanche process. We define this case as shedding and resurfacing (S&ReS, type 2).
First, we consider a special case where the asteroid’s final spin rate after shedding is exactly ωshed. We denote the mass of shed material in this case as mc. Integrating Eq. (35) gives the asteroid’s spin rate, ω, when the mass, m, has been shed:
![Mathematical equation: ${\omega \over {{\omega _{\rm{c}}}}} = {\left[ {1 - {{15} \over 8}\left( {1 - {1 \over 3}{{\sin }^2}{\theta _{{\rm{FR}}}}} \right)m} \right]^\alpha },$](/articles/aa/full_html/2024/04/aa48112-23/aa48112-23-eq50.png) (36)
(36)
whereby the initial values of ω = ωc and m = 0 are applied and α = (3 csc2 θFR − 1)−1. Setting ω to stand as ωshed gives the critical mass, mc:
![Mathematical equation: ${m_{\rm{c}}} = {8 \over {15}}{\left( {1 - {1 \over 3}{{\sin }^2}{\theta _{{\rm{FR}}}}} \right)^{ - 1}}\left[ {1 - {{\left( {{{{\omega _{{\rm{shed }}}}} \over {{\omega _{\rm{c}}}}}} \right)}^{1/\alpha }}} \right].$](/articles/aa/full_html/2024/04/aa48112-23/aa48112-23-eq51.png) (37)
(37)
If mF ≤ mc, all the failure-mobilised regolith would be shed in the end.
On the contrary, if mF > mc, some failure-mobilised regolith of mass mres = mF − mc remains in the FR when the spin rate drops below ωshed. This remnant regolith is eventaully deposited at the equator. Hence, integrating Eq. (24) with dLshed = 0 gives the asteroid’s final spin rate:
![Mathematical equation: ${\omega _{{\rm{final }}}} = {\left[ {1 + {{{1 \over 3}{m_{{\rm{res}}}}{{\sin }^2}{\theta _{{\rm{FR}}}}} \over {{8 \over {15}} - {m_{\rm{c}}}\left( {1 - {1 \over 3}{{\sin }^2}{\theta _{{\rm{FR}}}}} \right)}}} \right]^{ - 1}}{\omega _{{\rm{shed }}}},$](/articles/aa/full_html/2024/04/aa48112-23/aa48112-23-eq52.png) (38)
(38)
in which the initial value m = mc, ω = ωshed and the final value m = mF, ω = ωflnal are applied. In summary, the S&ReS case involves partial shedding and final resurfacing at the equator.
3.4.3 Type 3 and 4: Shed and bound (S-Bound), shedding and escaping (S-Escp)
When ωc > ωshed and ω is high enough to meet mF > mc, all the failure-mobilised regolith is shed of during the avalanche. With the assumption that the velocity of the shed regolith in the moment of shedding is ω, the relative velocity of the shed regolith to the surface is zero. If ω < ωescp, the shed material will be bound in the vicinity of the asteroid. On the contrary, if  , the shed material enters the escaping orbits.
We denote the case where ωc < ωescp as shed and bound (S-Bound, type 3), in which all the shed material is bound and does not escape. Likewise, the case where ωc > ωescp is denoted as shedding and escaping (S-Escp, type 4), in which some of shed regolith possesses enough mechanical energy to escape from the vicinity of the asteroid. For both types, from Eq. (36), we have the asteroid’s final spin rate after shedding:
![Mathematical equation: ${\omega _{{\rm{final }}}} = {\left[ {1 - {{15} \over 8}\left( {1 - {1 \over 3}{{\sin }^2}{\theta _{{\rm{FR}}}}} \right){m_{\rm{F}}}} \right]^\alpha }{\omega _{\rm{c}}}{\rm{. }}$](/articles/aa/full_html/2024/04/aa48112-23/aa48112-23-eq54.png) (39)
(39)
In type 2 (S-Bound) and type 4 (S-Escp), all the mobilised regolith is shed off. The difference of these two types is whether the shed material possesses enough mechanical energy to escape.
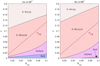 |
Fig. 8 Hreg − C diagram of the types of failure events with given internal friction (a) ϕ = 40° and (b) ϕ = 50°, in which the parameter regions of each of the types are presented. The dark red dashed line indicates the effective stress level σreg ~ 4H/3 in the regolith layer. |
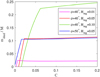 |
Fig. 9 Proportion of the mass of shed material (mshed) in the total mass of the asteroid (M = 4/3). |
3.5 Diagram of avalanche events, mass loss, and spin-down
As shown in Fig. 8, based on our model, with ϕ and Hreg given, the type of the avalanche event would progresses following the path ReS → S&ReS → S-Bound → S-Escp (type 1 → 2 → 3 → 4) as the cohesion increases. Moreover, as the internal friction increases from 40° to 50°, the S-Bound region expands, and the ReS region shrinks and even disappears for Hreg < 0.06 at ϕ = 50°. This is consistent with the fact that when the internal friction is larger, the regolith with relative low cohesion (C < 0.08) is more stable (Fig. 2).
Here, we discuss the results from our model in detail, including the mass loss from mass shedding and the asteroid’s spin down. As for the mass loss mshed in the post-failure process, we have mshed = 0 for the ReS event (type 1), mshed= mc for the S&ReS event (type 2), and mshed = mF for the S-Bound and S-Escp events (type 3 and 4). Combined with the conditions discussed in Sect. 3.4, the mass lost in the avalanche event can be calculated for the given ϕ, Hreg and C (Fig. 9). At ϕ = 40°, there is a range of C with no shedding (mshed = 0) for all the chosen Hreg. In contrast, at ϕ = 50°, mass shedding occurs for all C values, aligning with the fact shown in Fig. 8.
For all chosen ϕ and Hreg, mshed first increases rapidly with C, then slows after reaching a specific critical value. This trend can be readily explained. The range of C where mshed grows rapidly corresponds to the S&ReS (type 2) avalanche event. The mass loss mshed = mc is equal to mF when C is equal to the aforementioned specific value. If C exceed this value, the avalanche event would be S-Bound or S-Escp (types 3 and 4), where mshed = mF.
The post-failure avalanche leads to the asteroid’s spin-down due to the interaction between the asteroid body and the mobilised regolith. Figure 10 shows how the spin rate changes due to the avalanche event for given parameters, with a focus on the effect of the cohesion, C. Generally, the thicker regolith layer leads to more mobilised mass; hence, the spin-down of the asteroid due to the post-failure avalanche is more substantial.
4 Discussion
4.1 Regolith cohesion: Low but important
The mostly significant parameter in this work is the regolith’s cohesion. For a given thickness and internal friction, the cohesion dominates the type of the avalanche event and controls the outcome. However, the cohesion of the regolith on an asteroid’s surface is extremely low. For example, recent mission data show the surface cohesion of ≲2Pa on asteroids (101955) Bennu and ≲1Pa on (162173) Ryugu (Walsh et al. 2022; Jutzi et al. 2022). The near-zero surface cohesion enables high surface mobility (Nagaashi & Nakamura 2023). Consequently, many studies have assumed the surface regolith is cohesionless (Sánchez & Scheeres 2020; Cheng et al. 2021).
Although the regolith cohesion has a small numerical value, we find it plays an important role in the rotation-induced avalanche events. The low cohesion arises from the weak gravity, which results in extremely low effective stress level in the regolith. Hence, the surface regolith is loose and possesses fragile microscopic structure. Therefore, it is more reasonable to compare the cohesion to the effective stress level, rather than just focusing on its near-zero value.
The effective stress level σreg can be approximated by σreg ~ ρgH, where g is the surface gravitational acceleration and H is the depth of regolith. In our model, the gravity, g, and the regolith thickness, H, are given by g = 4πGρR/3 and H = Hreg. Thus, the stress level can be approximated by:
 (40)
(40)
Applying the normalisation in Sect. 2.1 gives the normalised stress:
 (41)
(41)
as shown the dark red dashed curve in Fig. 8. For the qualitative magnitude comparison of C and σreg in an asteroidal environment, Bennu’s data is used in the following analysis. Thus, the density is set to ρ ~ 1200 kg m−3 and the mean radius is set to R ≈ 250 m. Equation (40) gives the ratio of the cohesion to the effective stress level:
 (42)
(42)
where C and Hreg are un-normalised values.
The actual thickness of an asteroid’s regolith layer remains unknown. Via the scaling relationship of the asteorid’s internal dissipation, Nimmo & Matsuyama (2019) estimate the thickness of the regolith layer to be ~30 m. This estimation is applied in our analysis for the magnitude comparison. We denote the depth in which the failure occurs as ‘the effective thickness’, corresponding to Hreg in this work. This effective thickness can be much smaller than the aforementioned regolith thickness of ~30m. Conservatively, the regolith thickness is assumed to be Hreg ≈ 30 m and applying C ≲ 2 Pa, we have:
 (43)
(43)
Therefore, for a Bennu-sized asteroid, the surface effective stress level σreg and the regolith cohesion, C, could have similar magnitude. Back to Fig. 8, it shows that the transitions of several avalanche types occurs when C ≲ σreg. It means that despite the regolith cohesion is small, the cohesion can still significantly influence post-failure surface evolution and the fate of the shed material.
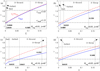 |
Fig. 10 Asteroid’s final spin rate after avalanche with different material and structure parameters, in which the dashed red lines and the blue solid lines indicate ωc = ω(+) and ωfinal, respectively. Different parameter ranges correspond to different types of failure events, which is marked in the figures. The boundaries of each of the types is presented as dotted lines and the corresponding C values are marked in bold. |
4.2 Fate of the shed mass
The fate of the shed material is controlled by several factors, such as the properties of the regolith layer and the shape of the asteroids. In this work, the focus is on the influence of the regolith mechanical properties, especially the cohesion.
Generally, for a stronger regolith cohesion, the critical spin rate ωc is higher (Fig. 2). This means that if the regolith is cohesive enough, the shed material may possess sufficient mechanical energy to escape from the asteroid’s gravitation (other factors, such as solar radiation pressure, are not considered here). On the other hand, if the cohesion is low (below a specific value Cbound), the shed material is likely to be bounded by the asteroid’s gravitation and remain in the vicinity of the asteroid. In our model presented in Sect. 3.4, the shed material escapes the asteroid’s gravitation only in S-Escp (type 4) events. Therefore, the Cbound curve is exactly the boundary between S-Bound (type 3) and S-Escp (type 4) in Fig. 8. Additionally, Cbound increases as the regolith thickness Hreg grows, indicating that a thinner regolith layer is more likely to produce escaping material in avalanches.
Mass shedding on a asteroid could lead to the formation of a dust tail, which is a key evidence for asteroid activity (Jewitt et al. 2015). Yu & Michel (2018) suggest that the solar radiation pressure is efficient to clear small particles (≲1mm) from the vicinity of the asteroid. Subsequently, these small particles will join the dust tail of the asteroid. However, larger particles and rocks are governed by the gravitation. Thus, they can escape the gravitation and join the tail only if sufficient mechanical energy is possessed.
The bounded shed material stays in the vicinity of the asteroid and there are three types of potential dynamical fates. Apparently, the shed material could finally return to the asteroid’s surface. Otherwise, it remained in the orbit and its journey may end in: (a) being gathered into a secondary body; (b) forming ring structures; (c) remaining in the orbit, and joining the debris cloud around the asteroid; or (d) escaping finally after a relatively long time (Sicardy et al. 2019; Walsh et al. 2008). The ultimate fate of the shed material depends on its dynamics parameters, particularly those at the moment of shedding (Kokubo et al. 2000).
Our work reveals the connection between the regolith mechanical properties and the dynamical fates of the shed mass using a semi-analytical models (Sect. 3). Although the model is simplified, it allows for a qualitative analysis of several intrinsic mechanisms. In future research, combining these mechanisms with the dynamical propagation of the shed debris could lead to a better understanding of the relationship between the regolith properties and the post-shedding evolution of a fast-rotating asteroid.
4.3 Timescales of YORP-induced shedding events
The rotational instability could trigger the surface landslides, followed by the spin-down of the asteroid. Here, we focus our attention on the case of spin-down with mass shedding. If the YORP torque is continued to accelerate the asteroid’s spin rate, there will be incremental mass shedding events after the initial one. Some active asteroids, such as 311P/PANSTARRS and (6478) Gault, are found to have multiple streamers of grains shed from them at very low relative speeds. The incremental mass shedding events could lead to create a debris cloud (or disk) surrounding the asteroid, in which the asteroid’s satellites might form and grow. The time interval of 2 close mass shedding events Tshed is suggested to be crucial in the formation pathways of satellites (Madeira et al. 2023), thus, it is mainly focused on this section.
The YORP effect on asteroids is sensitive to many factors such as the thermal parameters and the surface morphology (Statler 2009). Simulating the self-consistent YORP evolution of the rubble pile is beyond the scope of our semi-analytical investigation. For simplicity, we assume that the YORP torque remains constant in the spin-up to get a qualitative insight of the timescale of the YORP-induced shedding. Following the estimation from Scheeres (2015), we have the YORP-induced spin acceleration:
 (44)
(44)
where G1 ~ 1 × 10¹⁴ kg km s−2, a and e are the semi-major axis and eccentricity of the asteroid’s heliocentric orbit, while R and M are the asteroid’s radius and mass. In addition, C0 is the normalised YORP coefficient, which is mainly related to the asteroid’s shape. Thus, the timescale of YORP-induced shedding is given by:
 (45)
(45)
where Δω is the variation of the asteroid’s spin rate during the post-failure avalanche. In the remainder of this section, we take the asteroid 311P as an example, estimating its shedding timescale with aforementioned assumptions.
The 311P/PANSTARRS S-type asteroid has a radius of approximately 200 meters. Nine dust ejection event were detected and the time interval between two close events lies in the range of a few days to a few months (Jewitt et al. 2015). The ratio the of total ejected mass to the nucleus mass is ƒM ~ 3 × 10⁻⁵, which is a very small fraction. The spin period of 311P is estimated to be P ≥ 5.4 h, which is much longer than the common-known spin period limit of~2 h for the asteroids with radius larger than ~200 m (Jewitt et al. 2018). This limit is suggested to be related to the rotational instability of the rubble pile (Sánchez & Scheeres 2014).
The observed shedding activities on 311P are believed to be triggered by the rotational disruption (Jewitt et al. 2018). The small fraction of shed mass to the asteroid indicates that the rotational failure involving only a shallow layer on the surface. Specifically, the total shed mass corresponds to a global surface layer of ~2mm in thickness. In addition, the very low ƒM might also indicate that the regolith failure only occurred in a small fraction of the surface area (Jewitt et al. 2015).
With respect to our results in Fig. 10, it is shown that the spin-down due to avalanche is approximately Δω ~ Hreg. Based on the aforementioned ~2 mm thickness of equivalent layer, it is appropriate to assume the effective thickness is ~1cm, corresponding to Hreg ~ 10−4. Thus, the change of spin rate is Δω ~ 10−4. Applying Eq. (44), we have ωYORP ~ 10−4C0 yr−1. Scheeres (2007) shows that C0 can be larger than 0.01 for such elongated bodies as (433) Eros. The unusually large spin period of 311P might suggest its elongated shape, hence we set C0 ~ 0.01 for a rough estimation. Therefore, the timescale of YORP-induced shedding can be estimated as
 (46)
(46)
which is smaller than the ~1000yr result in Scheeres (2015).
However, it is important to note that the simplified model used in this work assumes a spherical asteroid with a symmetric failure region in longitude (Fig. 4), which may not accurately represent the actual shape and failure mechanisms of 311P. If its elongated shape is taken into account, the fraction of the actual failure region to the total surface could be significantly lower, potentially by two orders of magnitude, leading to a similar correction in the estimation of Δω. Therefore, while the current model suggests a time interval of approximately 100 yr between shedding events, an additional consideration of the asteroid’s shape and failure mechanism could lead to a significantly shorter time interval of ~1 yr, which is approximately comparable to the observed timescale.
5 Conclusions
This paper investigates the regolith landsliding and shedding activity on asteroids through a qualitative semi-analytical model. It is revealed that the dynamics of these surface activities are controlled by the properties of surface regolith layer. Importantly, four basic types of the rotational disruption (avalanche) with their corresponding regions in the parameter space are identified in this work:
- Type 1:
Resurfacing (ReS). No failure-mobilised material is shed from the surface and the avalanche process only involves resurfacing on the asteroid. All the mobilised material is deposited in the equatorial region in the end;
- Type 2:
Shedding and resurfacing (S&ReS). Some of the mobilised material is shed off and the rest is deposited in the equatorial region;
- Type 3:
Shed and bound (S-Bound). All the mobilised material is shed off, but none of the shed particle have enough energy to escape from the asteroid’s gravitation;
- Type 4:
Shedding and escaping (S-Escp). All the mobilised material is shed off and some shed particles have enough energy to escape from the asteroid’s gravitation.
Specifically, our analysis highlights the significance of the regolith cohesion in the asteroid’s surface activity, despite it is very low (less than 1 ~ 2 Pa for Bennu). Our model also suggests a possible link between the regolith layer properties and the evolution of the shed material. Moreover, the timescale of YORP-induced shedding events is discussed. The timescale of the shedding events on 311P is estimated as Tshed ~ 100 yr, which is shorter than the previous estimation. The non-spherical shape is also mentioned in the discussions on 311P. Taking this into account might significantly reduce the estimated Tshed. An updated model equipped to deal with this factor will be presented in the next paper (currently in preparation).
Acknowledgements
The authors acknowledge financial support provided by the National Natural Science Foundation of China Grant Nos. 12372047, 12272018 and 62227901.
References
- Bierhaus, E. B., Rossmann, F., Johnson, C., et al. 2023, Icarus, 406, 115736 [NASA ADS] [CrossRef] [Google Scholar]
- Bovie, D., Quillen, A. C., & Glade, R. 2023, arXiv e-prints [arXiv:2308.03749] [Google Scholar]
- Brisset, J., Sánchez, P., Cox, C., et al. 2022, Planet. Space Sci., 220, 105533 [CrossRef] [Google Scholar]
- Britt, D. T., & Consolmagno, G. J. S. J. 2001, Icarus, 152, 134 [NASA ADS] [CrossRef] [Google Scholar]
- Chandler, C. O., Kueny, J., Gustafsson, A., et al. 2019, ApJ, 877, L12 [NASA ADS] [CrossRef] [Google Scholar]
- Chen, W. F., & Liu, X. L. 1990, Limit Analysis in Soil Mechanics, 45 (Elsevier) [Google Scholar]
- Cheng, B., Yu, Y., Asphaug, E., et al. 2021, Nat. Astron., 5, 134 [Google Scholar]
- Cheng, B., Asphaug, E., Yu, Y., & Baoyin, H. 2023, Astrodynamics, 7, 15 [NASA ADS] [CrossRef] [Google Scholar]
- Cotto-Figueroa, D., Statler, T. S., Richardson, D. C., & Tanga, P. 2015, ApJ, 803, 25 [NASA ADS] [CrossRef] [Google Scholar]
- Delbo, M., Libourel, G., Wilkerson, J., et al. 2014, Nature, 508, 233 [Google Scholar]
- DeMeo, F. E., Marsset, M., Polishook, D., et al. 2023, Icarus, 389, 115264 [NASA ADS] [CrossRef] [Google Scholar]
- Divoux, T., Gayvallet, H., & Géminard, J.-C. 2008, Phys. Rev. Lett., 101, 148303 [NASA ADS] [CrossRef] [Google Scholar]
- Dobrovolskis, A. R. 1982, Icarus, 52, 136 [CrossRef] [Google Scholar]
- Ferrari, F., & Tanga, P. 2022, Icarus, 378, 114914 [NASA ADS] [CrossRef] [Google Scholar]
- Halsey, T. C., & Levine, A. J. 1998, Phys. Rev. Lett., 80, 3141 [CrossRef] [Google Scholar]
- Hestroffer, D., Sánchez, P., Staron, L., et al. 2019, A&ARv, 27, 6 [NASA ADS] [CrossRef] [Google Scholar]
- Hirabayashi, M. 2015, MNRAS, 454, 2249 [NASA ADS] [CrossRef] [Google Scholar]
- Hirabayashi, M., Sánchez, D. P., & Scheeres, D. J. 2015, ApJ, 808, 63 [NASA ADS] [CrossRef] [Google Scholar]
- Holsapple, K. A. 2008, Int. J. Non-Linear Mech., 43, 733 [NASA ADS] [CrossRef] [Google Scholar]
- Hu, S., Richardson, D. C., Zhang, Y., & Ji, J. 2021, MNRAS, 502, 5277 [NASA ADS] [CrossRef] [Google Scholar]
- Hyodo, R., & Sugiura, K. 2022, ApJ, 937, L36 [NASA ADS] [CrossRef] [Google Scholar]
- Jacobson, S. A., Marzari, F., Rossi, A., Scheeres, D. J., & Davis, D. R. 2014, MNRAS, 439, L95 [NASA ADS] [CrossRef] [Google Scholar]
- Jackson, P. M., Nakano, R., Kim, Y., & Hirabayashi, M. 2022, The Planetary Science Journal, 3, 16 [NASA ADS] [CrossRef] [Google Scholar]
- Jewitt, D. 2012, AJ, 143, 66 [CrossRef] [Google Scholar]
- Jewitt, D., Agarwal, J., Weaver, H., Mutchler, M., & Larson, S. 2015, ApJ, 798, 109 [Google Scholar]
- Jewitt, D., Weaver, H., Mutchler, M., et al. 2018, AJ, 155, 231 [NASA ADS] [CrossRef] [Google Scholar]
- Jewitt, D., Kim, Y., Luu, J., et al. 2019, ApJ, 876, L19 [NASA ADS] [CrossRef] [Google Scholar]
- Jutzi, M., Raducan, S. D., Zhang, Y., Michel, P., & Arakawa, M. 2022, Nat. Commun., 13, 7134 [Google Scholar]
- Kim, Y., DeMartini, J. V., Richardson, D. C., & Hirabayashi, M. 2023, MNRAS, 520, 3405 [NASA ADS] [CrossRef] [Google Scholar]
- Kokubo, E., Ida, S., & Makino, J. 2000, Icarus, 148, 419 [NASA ADS] [CrossRef] [Google Scholar]
- Lauretta, D. S., Hergenrother, C. W., Chesley, S. R., et al. 2019, Science, 366, eaay3544 [Google Scholar]
- Lowry, S. C., Weissman, P. R., Duddy, S. R., et al. 2014, A&A, 562, A48 [NASA ADS] [CrossRef] [EDP Sciences] [Google Scholar]
- Madeira, G., Charnoz, S., & Hyodo, R. 2023, Icarus, 394, 115428 [NASA ADS] [CrossRef] [Google Scholar]
- Minker, K., & Carry, B. 2023, A&A, 672, A48 [NASA ADS] [CrossRef] [EDP Sciences] [Google Scholar]
- Miyamoto, H., Yano, H., Scheeres, D. J., et al. 2007, Science, 316, 1011 [CrossRef] [Google Scholar]
- Molaro, J. L., Byrne, S., & Le, J. L. 2017, Icarus, 294, 247 [CrossRef] [Google Scholar]
- Nagaashi, Y., & Nakamura, A. M. 2023, Sci. Adv., 9, eadd3530 [NASA ADS] [CrossRef] [Google Scholar]
- Nimmo, F., & Matsuyama, I. 2019, Icarus, 321, 715 [NASA ADS] [CrossRef] [Google Scholar]
- Richardson, J. E., Melosh, H. J., Greenberg, R. J., & O’Brien, D. P. 2005, Icarus, 179, 325 [NASA ADS] [CrossRef] [Google Scholar]
- Rubincam, D. P. 2000, Icarus, 148, 2 [Google Scholar]
- Scheeres, D. J. 2007, Icarus, 188, 430 [CrossRef] [Google Scholar]
- Scheeres, D. J. 2015, Icarus, 247, 1 [NASA ADS] [CrossRef] [Google Scholar]
- Sicardy, B., Leiva, R., Renner, S., et al. 2019, Nat. Astron., 3, 146 [NASA ADS] [CrossRef] [Google Scholar]
- Song, Z., Yu, Y., Cheng, B., Lv, J., & Baoyin, H. 2023, A&A, 672, A172 [NASA ADS] [CrossRef] [EDP Sciences] [Google Scholar]
- Statler, T. S. 2009, Icarus, 202, 502 [NASA ADS] [CrossRef] [Google Scholar]
- Sánchez, P., & Scheeres, D. J. 2014, Meteor. Planet. Sci., 49, 788 [Google Scholar]
- Sánchez, P., & Scheeres, D. J. 2016, Icarus, 271, 453 [CrossRef] [Google Scholar]
- Sánchez, P., & Scheeres, D. J. 2018, Planet. Space Sci., 157, 39 [CrossRef] [Google Scholar]
- Sánchez, P., & Scheeres, D. J. 2020, Icarus, 338, 113443 [Google Scholar]
- Tang, Y., Lauretta, D. S., Ballouz, R. L., et al. 2023, Icarus, 395, 115463 [NASA ADS] [CrossRef] [Google Scholar]
- Tricarico, P., Scheeres, D. J., French, A. S., et al. 2021, Icarus, 370, 114665 [NASA ADS] [CrossRef] [Google Scholar]
- Walsh, K. J. 2018, ARA&A, 56, 593 [NASA ADS] [CrossRef] [Google Scholar]
- Walsh, K. J., Richardson, D. C., & Michel, P. 2008, Nature, 454, 188 [Google Scholar]
- Walsh, K. J., Richardson, D. C., & Michel, P. 2012, Icarus, 220, 514 [NASA ADS] [CrossRef] [Google Scholar]
- Walsh, K. J., Ballouz, R.-L., Jawin, E. R., et al. 2022, Sci. Adv., 8, eabm6229 [NASA ADS] [CrossRef] [Google Scholar]
- Yu, Y., & Michel, P. 2018, Icarus, 312, 128 [NASA ADS] [CrossRef] [Google Scholar]
- Yu, Y., Michel, P., Hirabayashi, M., & Richardson, D. C. 2019, MNRAS, 484, 1057 [NASA ADS] [CrossRef] [Google Scholar]
- Zhang, Y., & Michel, P. 2021, Astrodynamics, 5, 293 [NASA ADS] [CrossRef] [Google Scholar]
- Zhang, Y., Richardson, D. C., Barnouin, O. S., et al. 2018, ApJ, 857, 15 [Google Scholar]
- Zhang, Y., Michel, P., Richardson, D. C., et al. 2021, Icarus, 362, 114433 [CrossRef] [Google Scholar]
- Zhang, Y., Michel, P., Barnouin, O. S., et al. 2022, Nat. Commun., 13, 4589 [NASA ADS] [CrossRef] [Google Scholar]
Either way, the total mass of mobilised regolith mF is relatively too large.
All Figures
|
Fig. 1 Spheroid model with an internal core covered by loose regolith layer. The total radius is normalised to 1. |
| In the text | |
|
Fig. 2 Upper bound and lower bound of critical spin rate as the function of regolith cohesive strength C. (a−c) The friction angle is ϕ = 30° and the regolith thickness vavies from Hreg → 0 to Hreg = 0.10. (b) The friction angle is set to be a larger value ϕ = 40° and the thickness of the regolith is Hreg = 0.05. N: no mass shedding; PMS: possible mass shedding; and MS: mass shedding. |
| In the text | |
|
Fig. 3 Dynamical cohesion, C*, distribution in a Hreg = 0.1 regolith layer under different spin rates and the friction angle is set to be 30°. The maximum C* in the layer is denoted as |
| In the text | |
|
Fig. 4 Actual failure region in the regolith layer, which is local and not symmetric in longitude (a). The failure region considered in this work is assumed to be symmetric in both longitude and latitude (b), which is −θFR ≤ θ ≤ θFR. |
| In the text | |
|
Fig. 5 Determination of θ R. |
| In the text | |
|
Fig. 6 Result of (a) the latitude boundary of failure region θFR and (b) the ratio of the mobilised mass, mF, in the asteroid’s total mass, M. |
| In the text | |
|
Fig. 7 Simplified model of surface mass movement. Here, we have H = Hreg − h, where h indicates the depth of regolith deposits that has been moved thus far. The failure region is −θFR < θ < θFR, denoted as FR in the figure. The newly moved regolith mass is dm = 4 sin θFRdh and it is originally located in the depth h to h + dh. |
| In the text | |
|
Fig. 8 Hreg − C diagram of the types of failure events with given internal friction (a) ϕ = 40° and (b) ϕ = 50°, in which the parameter regions of each of the types are presented. The dark red dashed line indicates the effective stress level σreg ~ 4H/3 in the regolith layer. |
| In the text | |
|
Fig. 9 Proportion of the mass of shed material (mshed) in the total mass of the asteroid (M = 4/3). |
| In the text | |
|
Fig. 10 Asteroid’s final spin rate after avalanche with different material and structure parameters, in which the dashed red lines and the blue solid lines indicate ωc = ω(+) and ωfinal, respectively. Different parameter ranges correspond to different types of failure events, which is marked in the figures. The boundaries of each of the types is presented as dotted lines and the corresponding C values are marked in bold. |
| In the text | |
Current usage metrics show cumulative count of Article Views (full-text article views including HTML views, PDF and ePub downloads, according to the available data) and Abstracts Views on Vision4Press platform.
Data correspond to usage on the plateform after 2015. The current usage metrics is available 48-96 hours after online publication and is updated daily on week days.
Initial download of the metrics may take a while.