Fig. A.1.
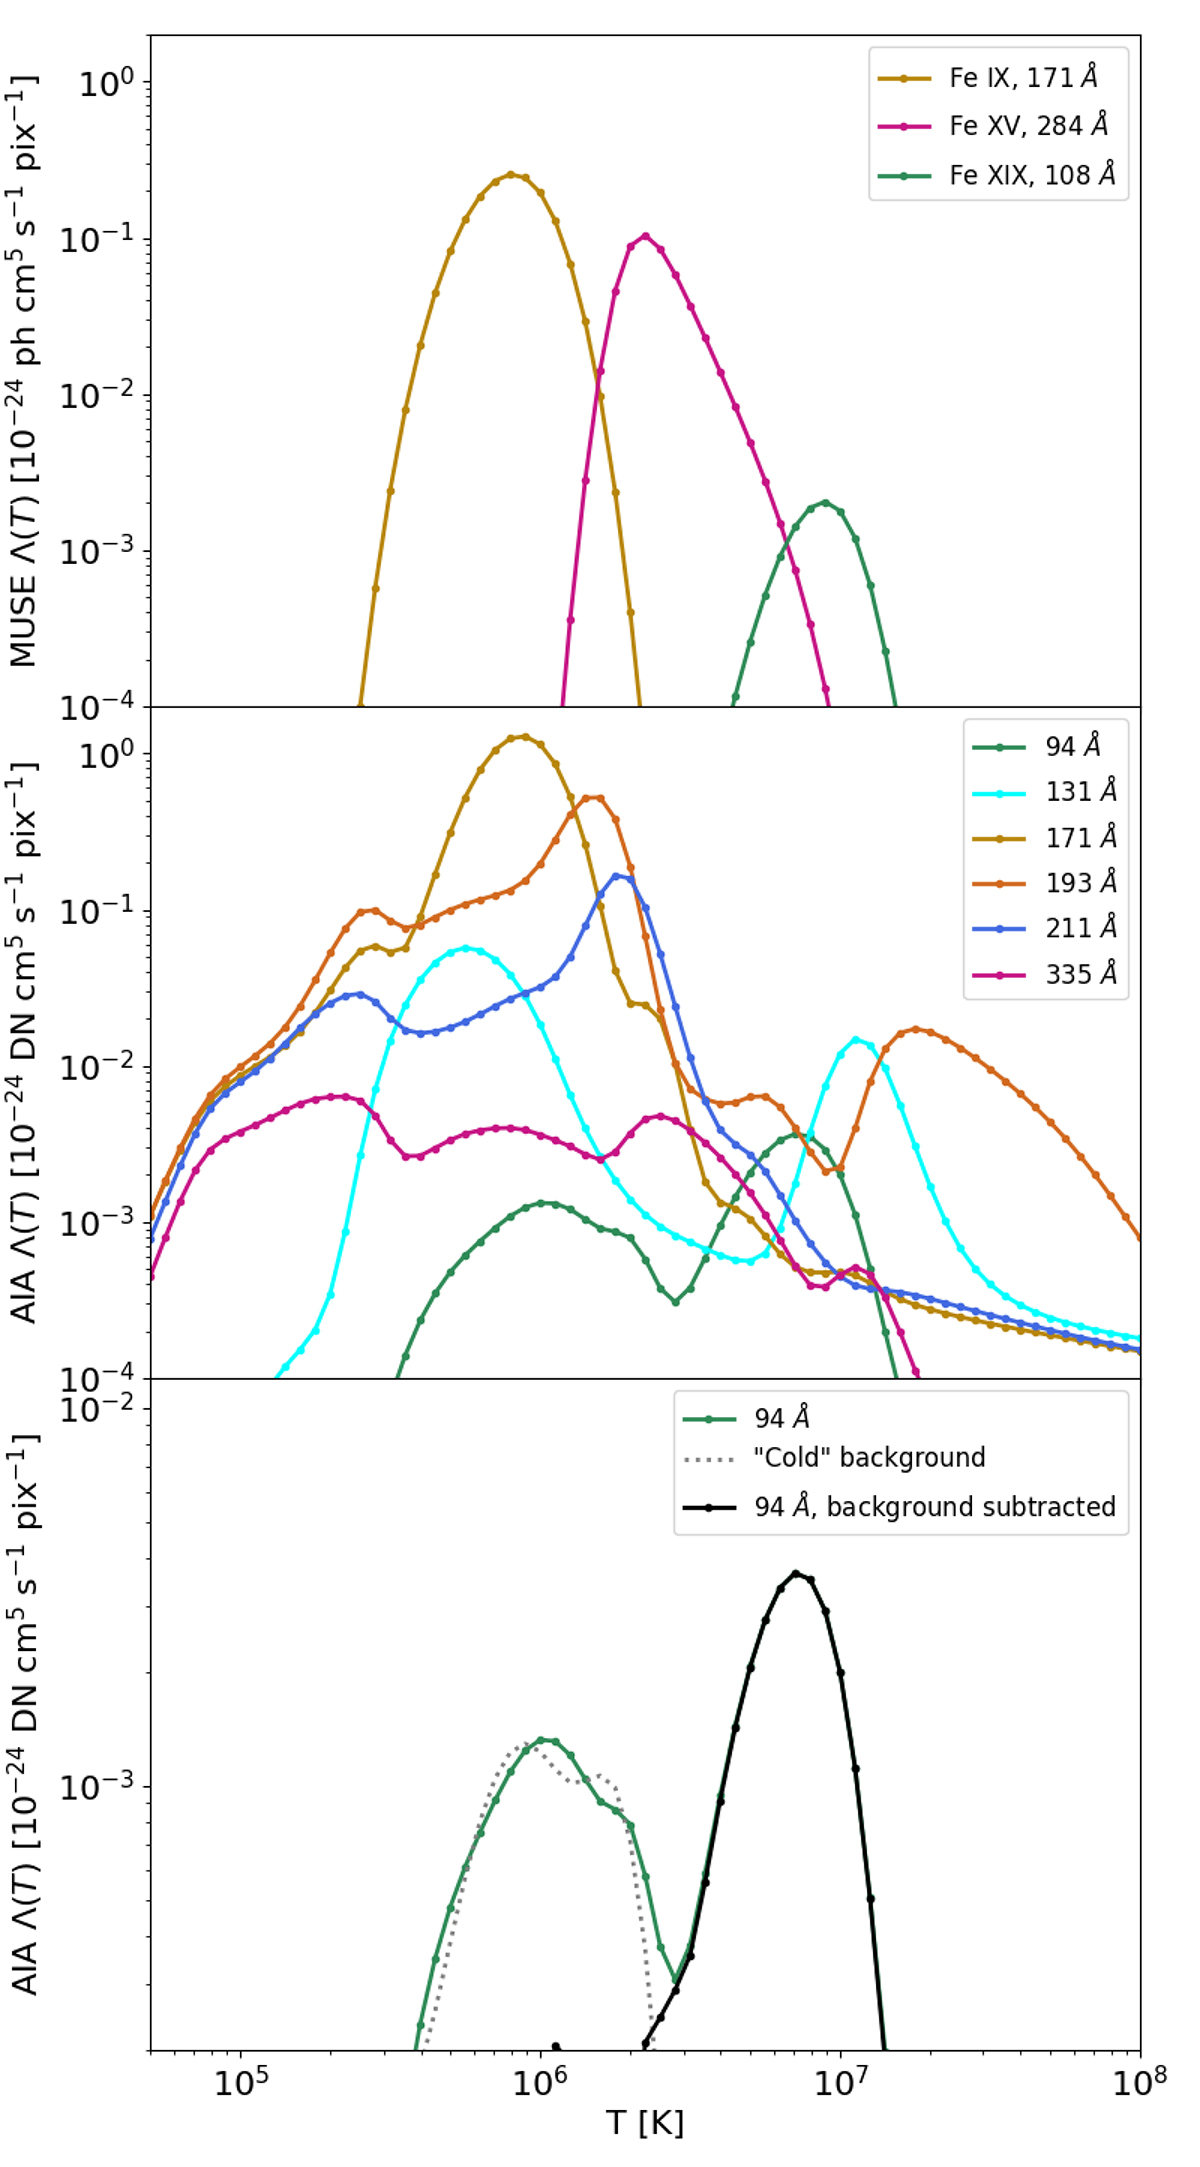
Download original image
Temperature response functions Λi(T) for the AIA and MUSE channels. Top: MUSE spectrometer lines: Fe IX 171 Å, Fe XV 284 Å, and Fe XIX 108 Å. Middle: AIA 94 Å (containing Fe XVIII line), 131 Å, 171 Å, 193 Å, 211 Å, and 335 Å channels. Bottom: expected response function of the 94 Å AIA channel (black line) after the subtraction of the cold component (dotted line) obtained by combination of 131 Å, 171 Å, 193 Å, 211 Å, and 335 Å AIA channels from the total one (light green).
Current usage metrics show cumulative count of Article Views (full-text article views including HTML views, PDF and ePub downloads, according to the available data) and Abstracts Views on Vision4Press platform.
Data correspond to usage on the plateform after 2015. The current usage metrics is available 48-96 hours after online publication and is updated daily on week days.
Initial download of the metrics may take a while.