Fig. 3.
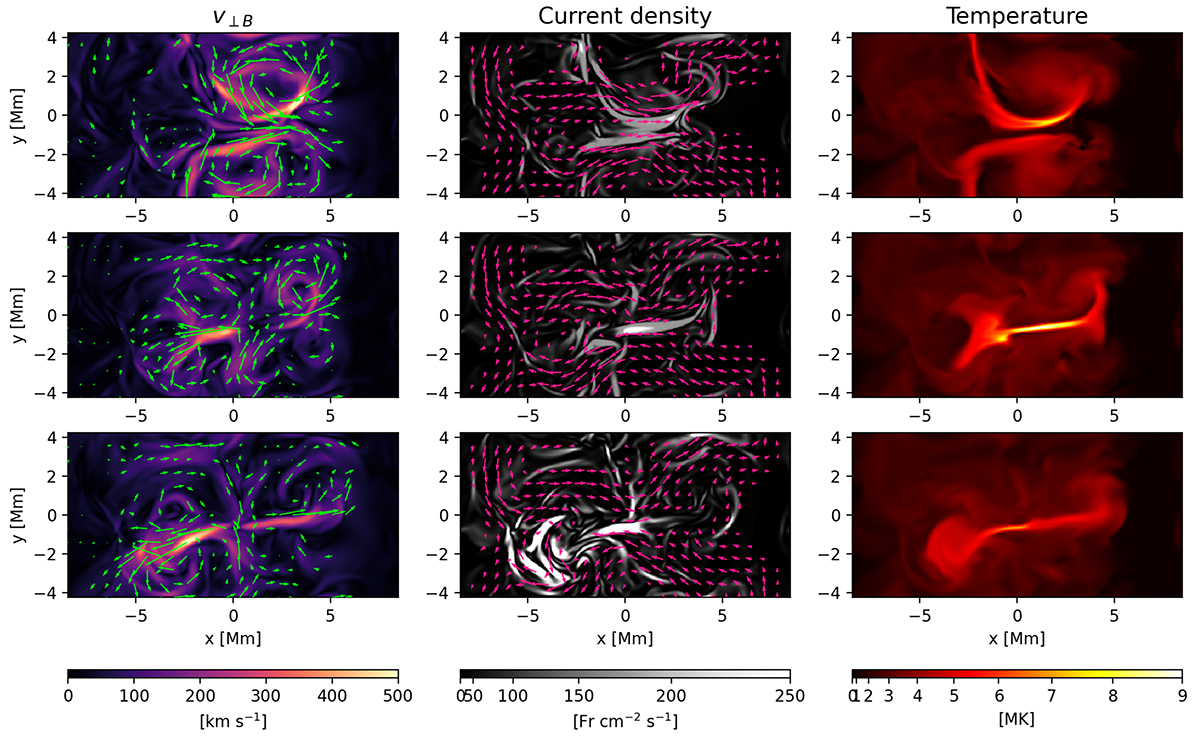
Download original image
Dynamics of the reconnection outflow. First column: Horizontal mid-plane map of the value of the velocity component perpendicular to the magnetic field at the same three times shown in Fig. 2, i.e. Δt = 0 s (top, current sheet formation), Δt = 10 s (middle, outflow acceleration), and Δt = 20 s (bottom, outflow deceleration). The velocity field in the plane is also shown (arrows). Second column: Horizontal mid-plane map of the current density. The map saturates where the current density exceeds the threshold value for dissipation. The magnetic field in the plane is also shown (arrows). Third column: Horizontal mid-plane map of the temperature. (See Movie 3.)
Current usage metrics show cumulative count of Article Views (full-text article views including HTML views, PDF and ePub downloads, according to the available data) and Abstracts Views on Vision4Press platform.
Data correspond to usage on the plateform after 2015. The current usage metrics is available 48-96 hours after online publication and is updated daily on week days.
Initial download of the metrics may take a while.