Fig. 2.
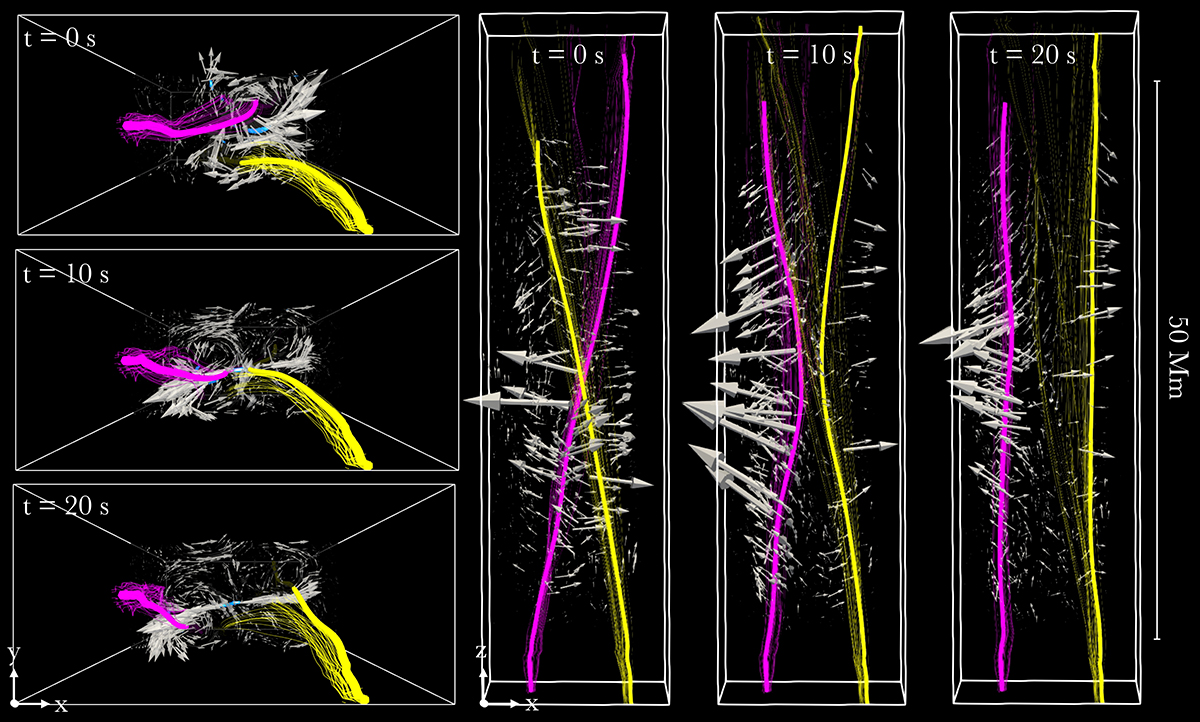
Download original image
Magnetic reconnection and the outflow. 3D Rendering at three different times since the beginning of the avalanche: Δt = 0 s (lines approaching), Δt = 10 s (lines reconnecting), and Δt = 20 s (new lines detaching). Left column, top view, and cut at the middle plane: Two reconnecting magnetic field lines (marked by yellow and magenta lines among two bundles), reconnection sites (blue spots close to the centre of the plane), and velocity field (white arrows), which shows the collimated outflow departing from the reconnecting lines (see Movie 1). Right row: Same reconnecting lines from a front view (the coronal part of the loop is 50 Mm long; see Movie 2).
Current usage metrics show cumulative count of Article Views (full-text article views including HTML views, PDF and ePub downloads, according to the available data) and Abstracts Views on Vision4Press platform.
Data correspond to usage on the plateform after 2015. The current usage metrics is available 48-96 hours after online publication and is updated daily on week days.
Initial download of the metrics may take a while.