Fig. 9
Download original image
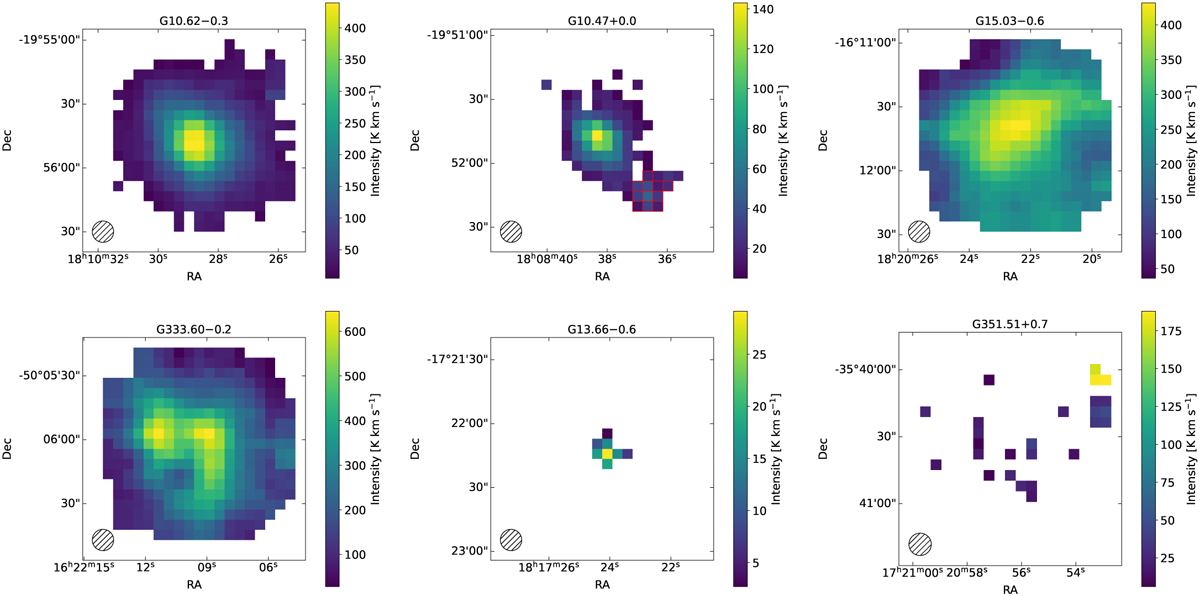
Examples of the different morphological types in our sample. Top row: The first two panels show two single-core sources: the left one is an isolated source, while the right one has a neighbouring clump whose pixels outlined in red were masked to exclude them from further analyses. The most-right panel presents an extended source. Second row: The first panel showcases fragmented cores. The two remaining panels illustrate two poorly resolved clumps characterised by compact emission in neighbouring pixels (left) and distributed pixels (right). The hatched circle at the bottom left corner of each panel indicates the FWHM of telescope beam.
Current usage metrics show cumulative count of Article Views (full-text article views including HTML views, PDF and ePub downloads, according to the available data) and Abstracts Views on Vision4Press platform.
Data correspond to usage on the plateform after 2015. The current usage metrics is available 48-96 hours after online publication and is updated daily on week days.
Initial download of the metrics may take a while.