Fig. 6
Download original image
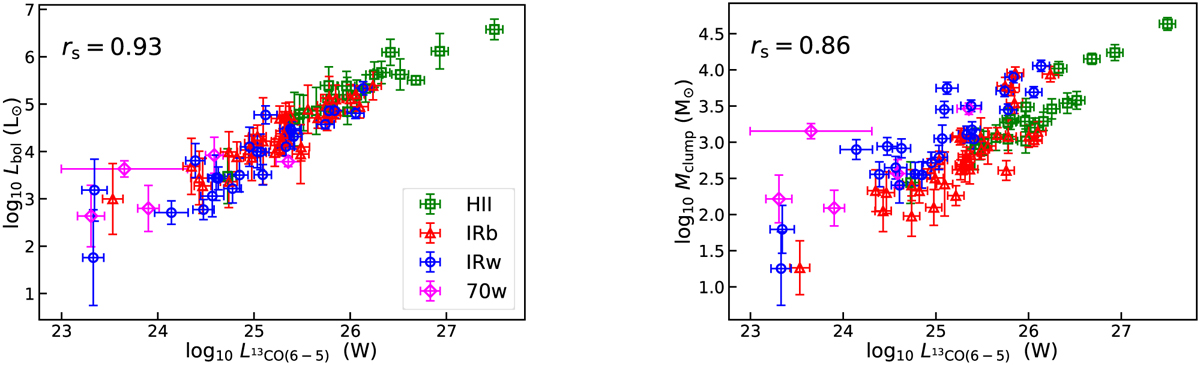
13CO (6−5) line luminosity as a function of bolometric luminosity (left) and clump mass (right). The sources in the HII, IRb, IRw, and 70w groups are shown as green squares, red triangles, blue circles, and magenta diamonds, respectively. The Spearman’s rank correlation coefficient, rs, between the two quantities is presented on each plot.
Current usage metrics show cumulative count of Article Views (full-text article views including HTML views, PDF and ePub downloads, according to the available data) and Abstracts Views on Vision4Press platform.
Data correspond to usage on the plateform after 2015. The current usage metrics is available 48-96 hours after online publication and is updated daily on week days.
Initial download of the metrics may take a while.