Fig. 4
Download original image
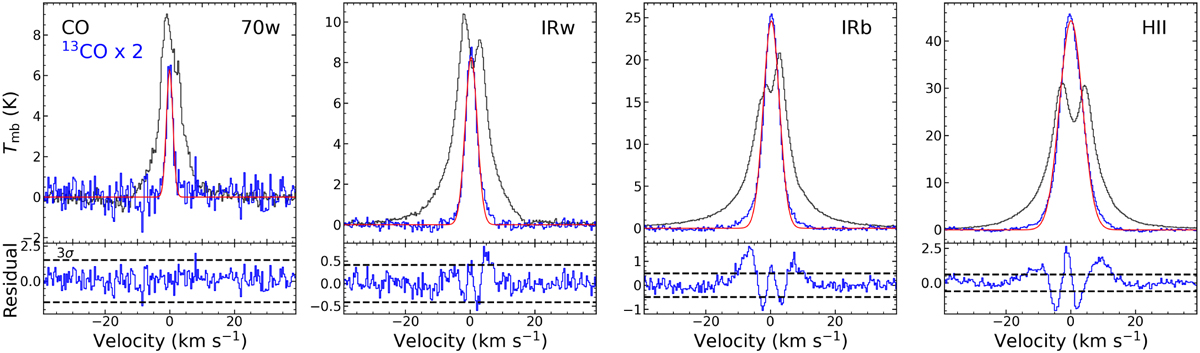
Representative 12CO (6−5) (black) and 13CO (6−5) (blue) spectra of the four evolutionary groups. The 13CO (6−5) spectra are scaled up by a factor of two for an easier comparison, and the fitted Gaussian functions are overlaid as red curves. In the bottom panels, the residuals from Gaussian fitting are shown with ±3σ noise levels (dashed lines).
Current usage metrics show cumulative count of Article Views (full-text article views including HTML views, PDF and ePub downloads, according to the available data) and Abstracts Views on Vision4Press platform.
Data correspond to usage on the plateform after 2015. The current usage metrics is available 48-96 hours after online publication and is updated daily on week days.
Initial download of the metrics may take a while.