Fig. 3
Download original image
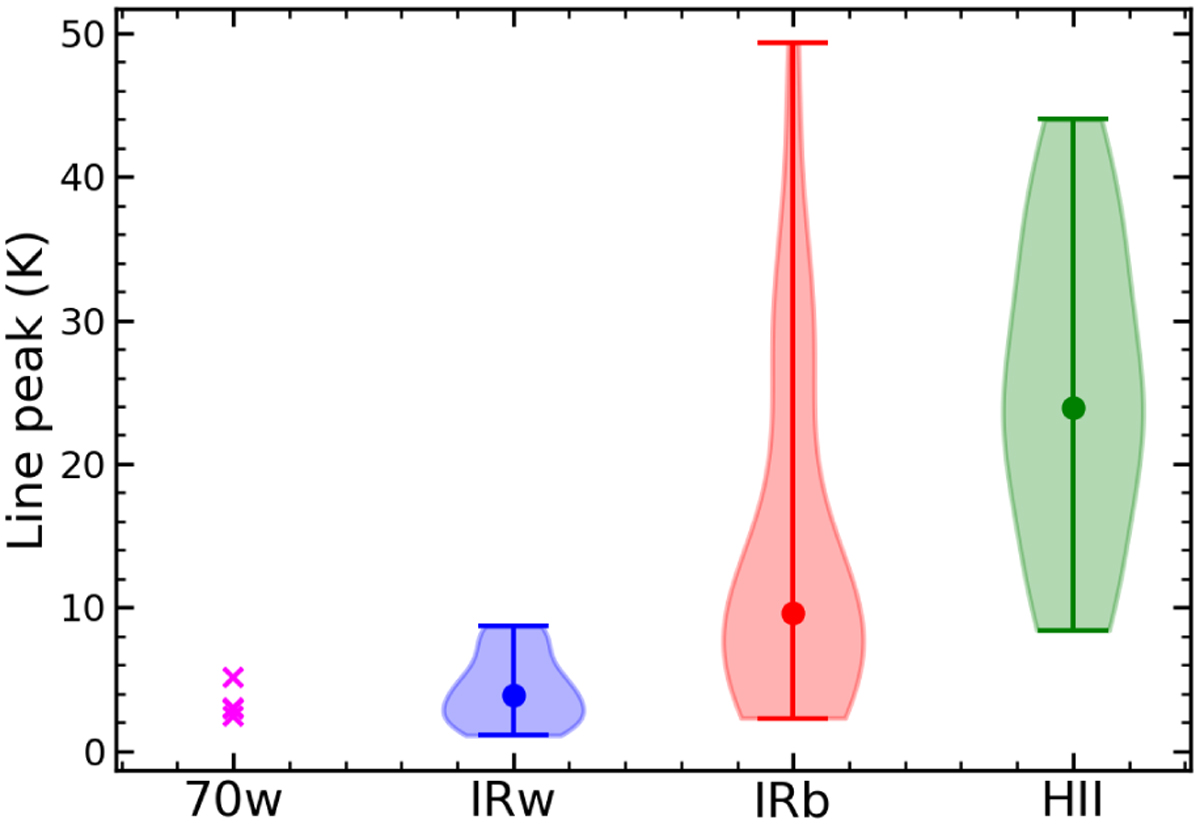
Distributions of the peak brightness temperatures. These temperatures were obtained from the average spectra within the 20″ -size central regions. For each evolutionary group, the minimum and maximum are shown as bars, while the median values are indicated as filled circles. For the 70w group that has only a few entries, the values for the individual sources are presented as crosses.
Current usage metrics show cumulative count of Article Views (full-text article views including HTML views, PDF and ePub downloads, according to the available data) and Abstracts Views on Vision4Press platform.
Data correspond to usage on the plateform after 2015. The current usage metrics is available 48-96 hours after online publication and is updated daily on week days.
Initial download of the metrics may take a while.