Fig. 20
Download original image
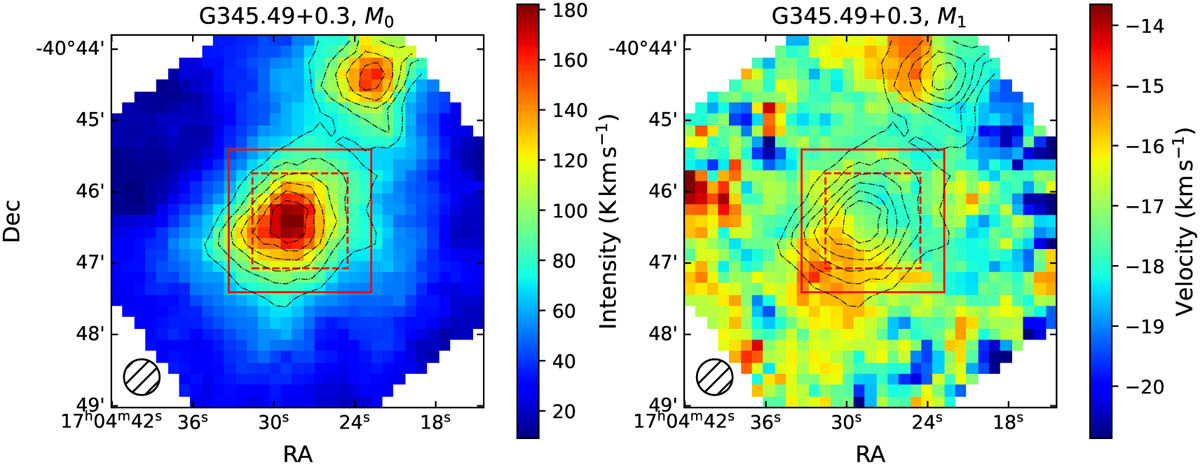
13CO(2−1) M0 (left) and M1 (right) maps of an example source, G345.49+0.3. In both maps, the integrated intensities are overlaid as contours with levels ranging from 40% to 90% in steps of 10% of the largest integrated intensity. The 80″ × 80″ coverages of the 13CO (6−5) data are outlined as dashed red boxes, while the 2′ × 2′ regions where we extracted clump-scale kinematics are indicated by solid red boxes. At the left bottom corner of each map, the FWHM of the telescope beam is shown by a hatched circle.
Current usage metrics show cumulative count of Article Views (full-text article views including HTML views, PDF and ePub downloads, according to the available data) and Abstracts Views on Vision4Press platform.
Data correspond to usage on the plateform after 2015. The current usage metrics is available 48-96 hours after online publication and is updated daily on week days.
Initial download of the metrics may take a while.