Open Access
Fig. 2
Download original image
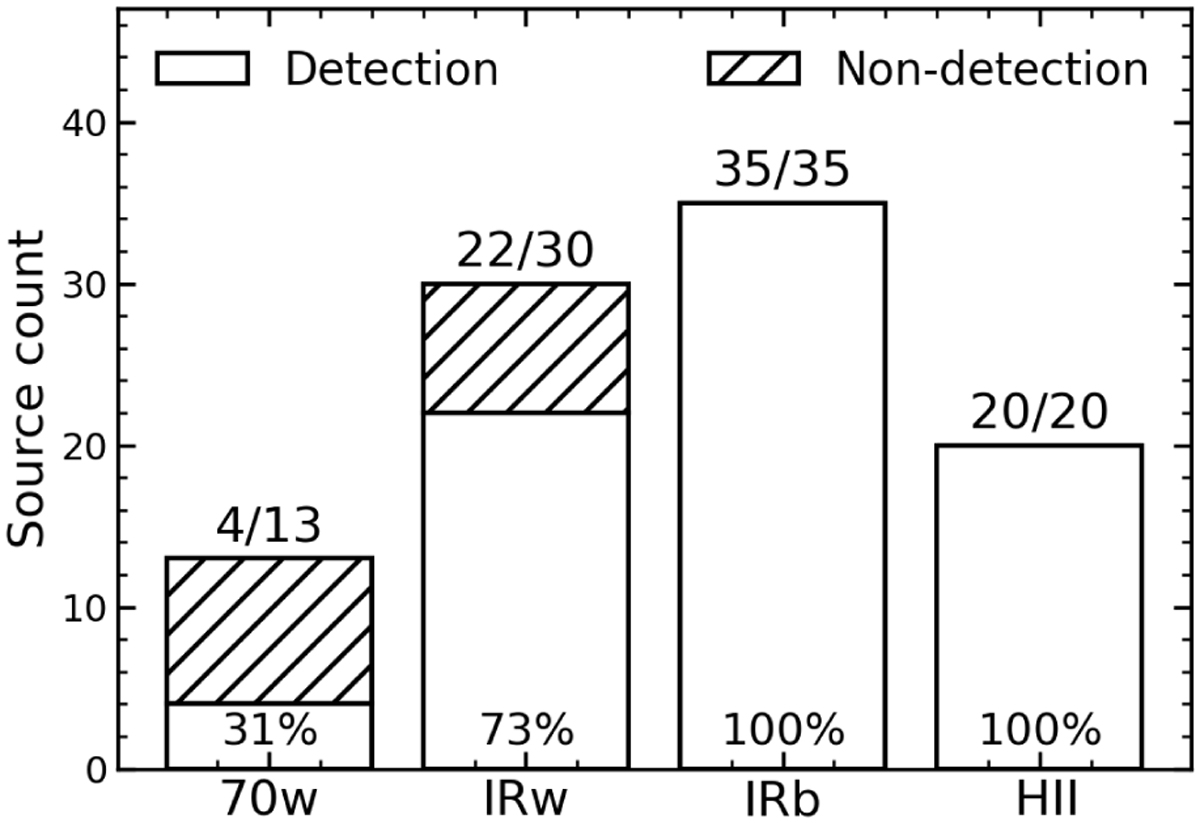
Detection statistics of 13CO (6−5) emission for the evolutionary groups. The exact number of the detected sources for the observed clumps is presented at the top of each bar, and the corresponding detection rates are shown in percentage terms.
Current usage metrics show cumulative count of Article Views (full-text article views including HTML views, PDF and ePub downloads, according to the available data) and Abstracts Views on Vision4Press platform.
Data correspond to usage on the plateform after 2015. The current usage metrics is available 48-96 hours after online publication and is updated daily on week days.
Initial download of the metrics may take a while.