Fig. 16
Download original image
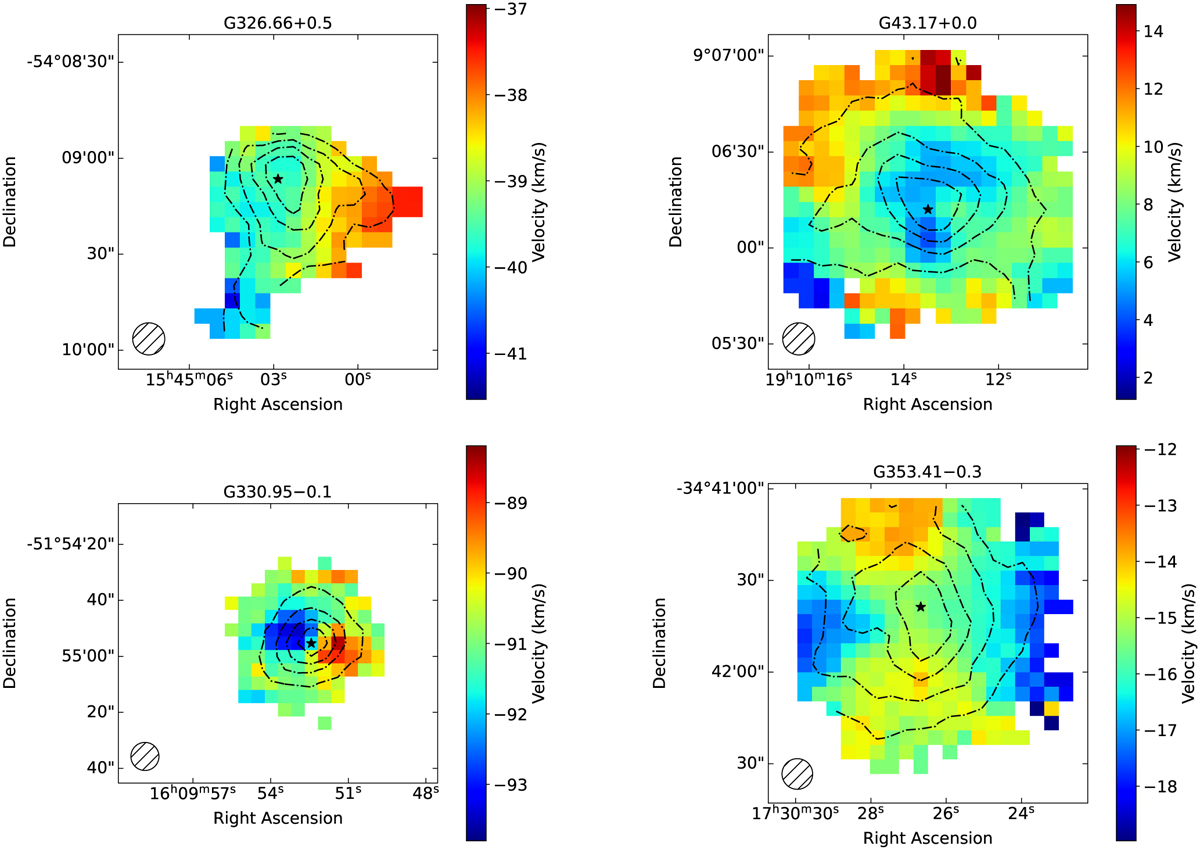
Examples of various velocity fields in our sample. The 13CO (6–5) M1 maps from the top left corner in the clockwise direction demonstrate linear, radial, hourglass-like, and outflow-like gradients, respectively. For each source, the integrated intensities are overlaid as contours with levels ranging from 20% to 80% of the peak value in steps of 20%, and the peak position is marked by a star. Finally, the FWHM of the telescope beam is shown by a hatched circle.
Current usage metrics show cumulative count of Article Views (full-text article views including HTML views, PDF and ePub downloads, according to the available data) and Abstracts Views on Vision4Press platform.
Data correspond to usage on the plateform after 2015. The current usage metrics is available 48-96 hours after online publication and is updated daily on week days.
Initial download of the metrics may take a while.