Fig. 15
Download original image
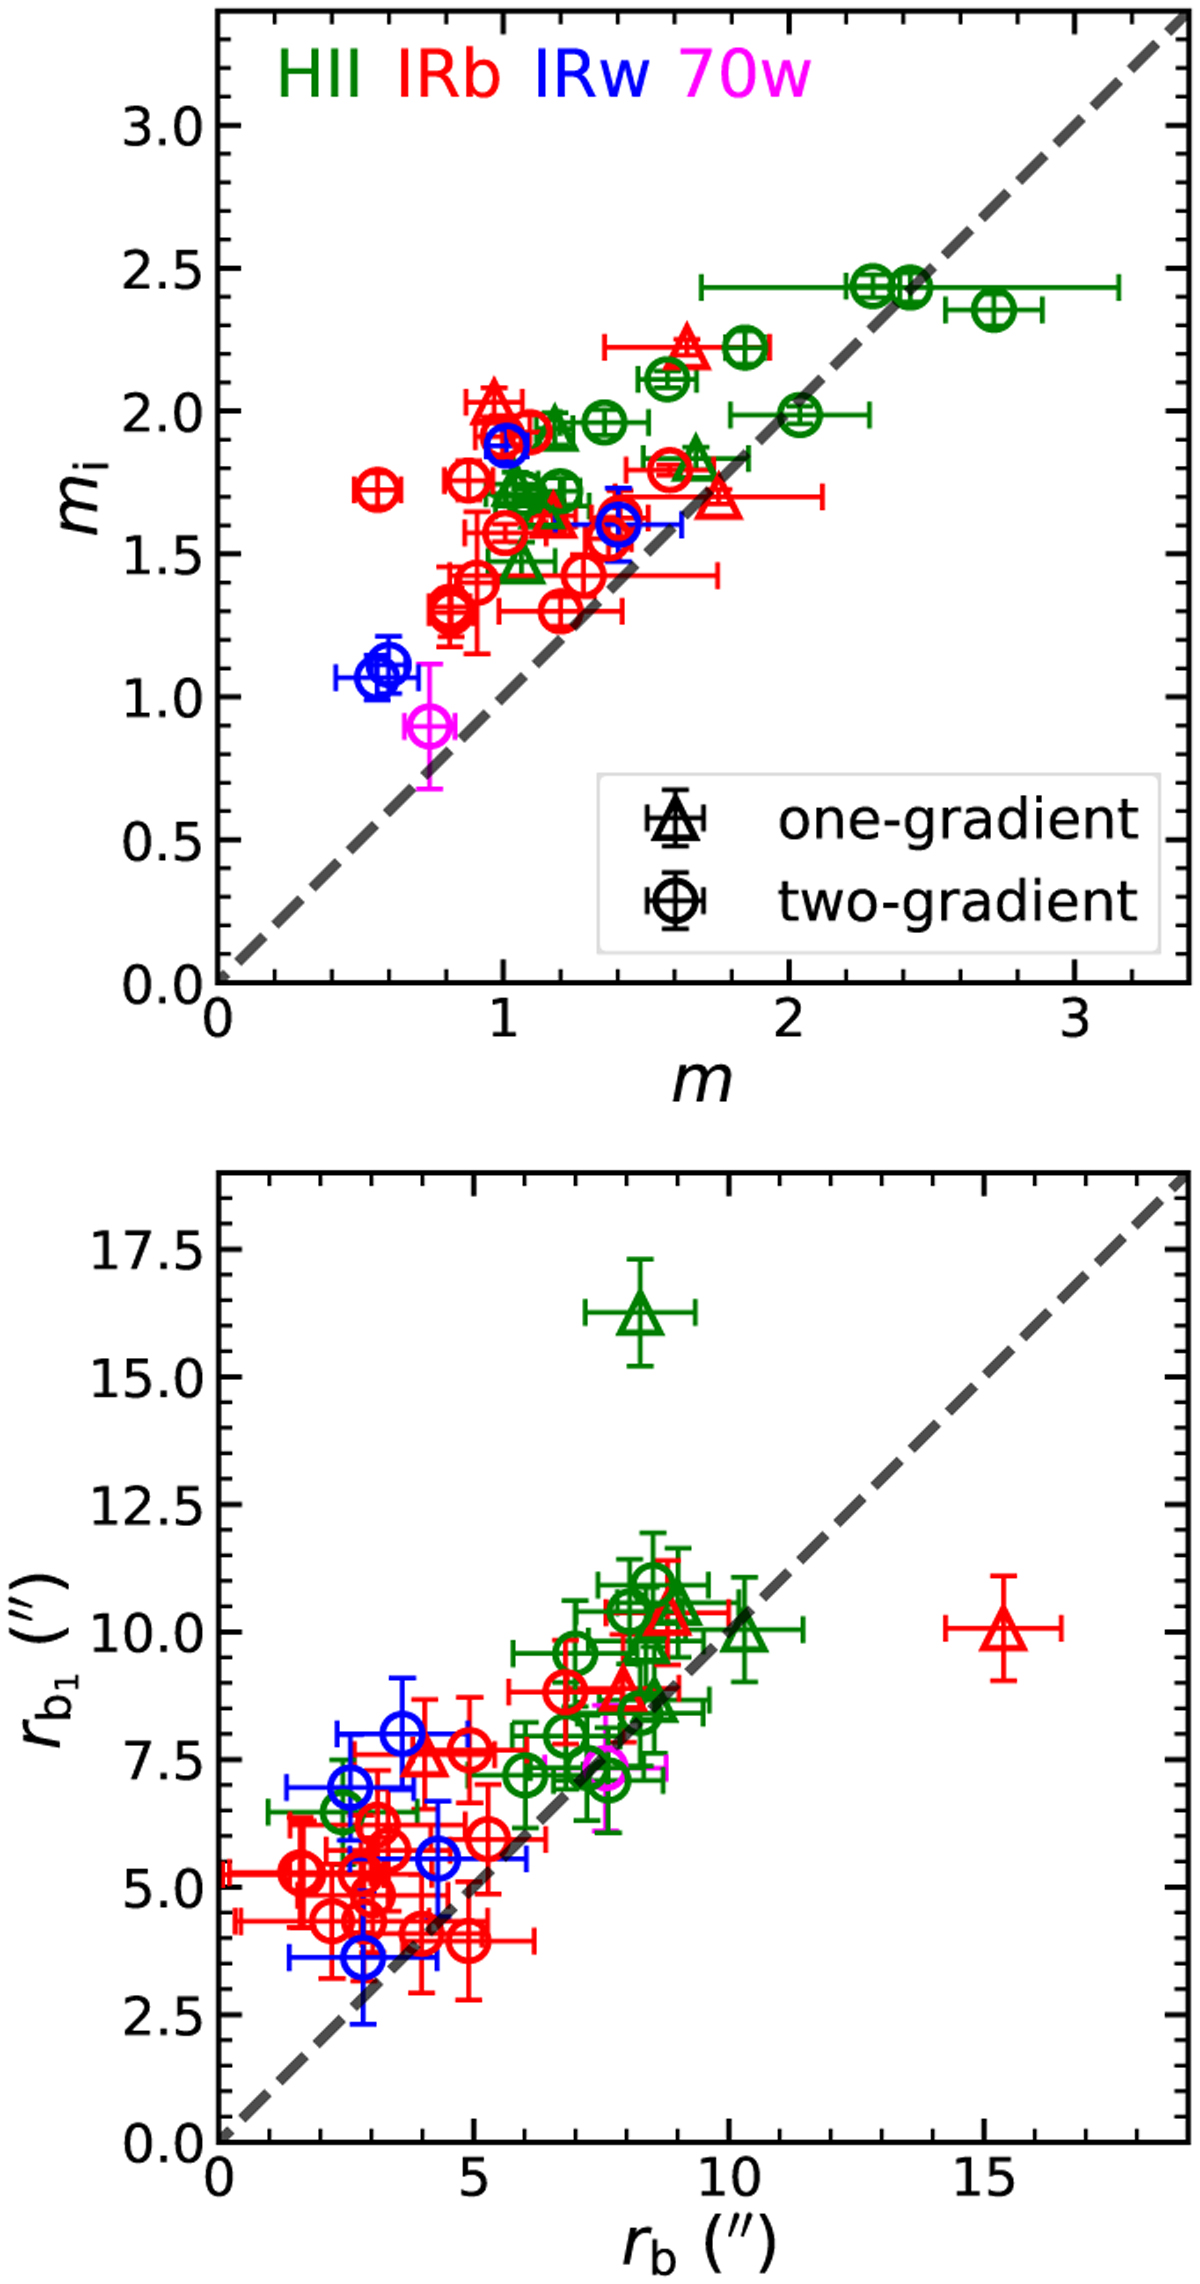
Comparison of the 160 µm and 13CO (6–5) radial profiles in terms of the power-law index (top) and break radius (bottom). The 27 sources whose 160 µm radial profiles were fitted with the two powerlaw model are shown as circles, and their inner power-law distributions are used for the comparison. The remaining nine sources with the single power-law distributions in 160 µm emission are indicated as triangles. Both circles and triangles are colour coded based on evolutionary stage: 70w, IRw, IRb, and HII in magenta, blue, red, and green, respectively. One-to-one relations are overlaid as dashed lines.
Current usage metrics show cumulative count of Article Views (full-text article views including HTML views, PDF and ePub downloads, according to the available data) and Abstracts Views on Vision4Press platform.
Data correspond to usage on the plateform after 2015. The current usage metrics is available 48-96 hours after online publication and is updated daily on week days.
Initial download of the metrics may take a while.