Fig. 14
Download original image
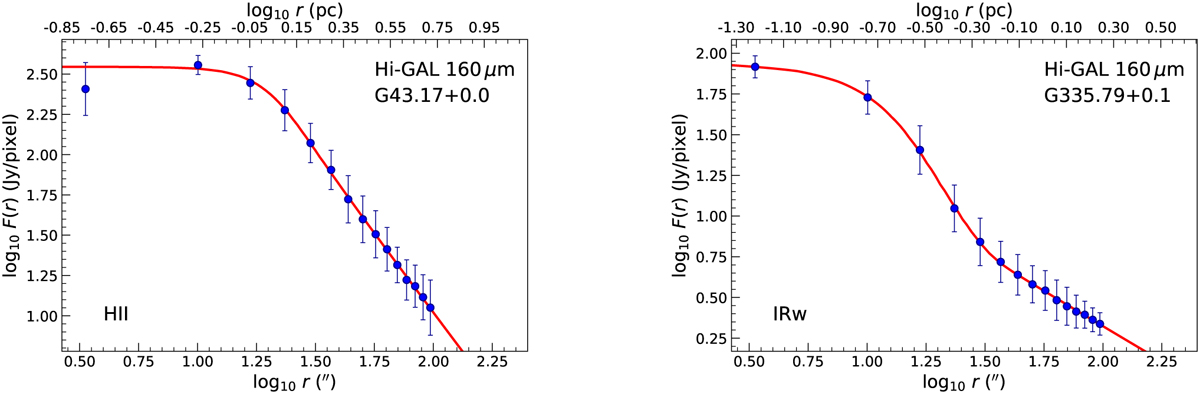
Example 160 μm radial profiles of G43.17+0.0 (left) and G335.79+0.1 (right). As in Fig. 11, the median and standard deviation values at 5″ -wide individual annuli are shown as blue circles and associated ‘error’ bars. Best-fit curves (singular and two power-law model for G43.17+0.0 and G335.79+0.1, respectively) are overlaid in red.
Current usage metrics show cumulative count of Article Views (full-text article views including HTML views, PDF and ePub downloads, according to the available data) and Abstracts Views on Vision4Press platform.
Data correspond to usage on the plateform after 2015. The current usage metrics is available 48-96 hours after online publication and is updated daily on week days.
Initial download of the metrics may take a while.