Fig. 11
Download original image
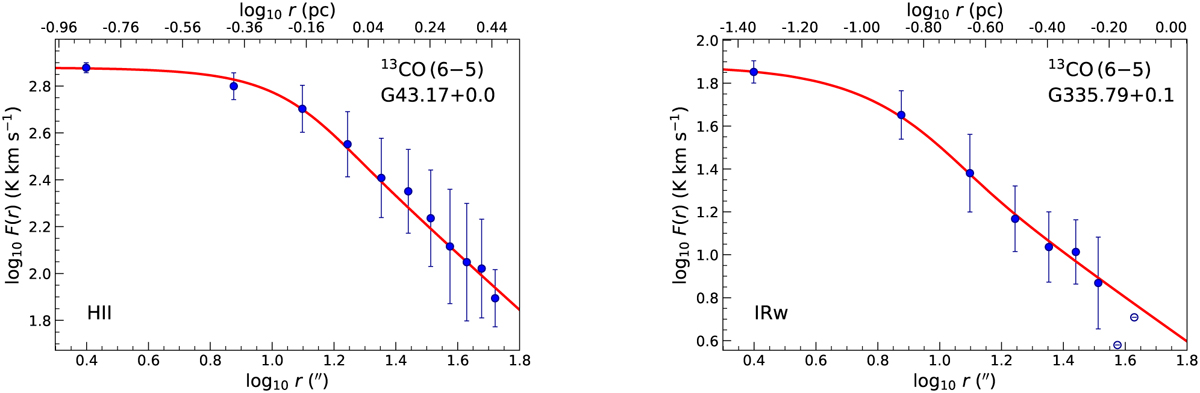
Example 13CO (6–5) radial profiles for an HII source (G43.17+0.0) (left) and an IRw source (G335.79+0.1) (right). At 5″-wide individual annuli, the median and standard deviation values are presented as filled blue circles and associated ‘error’ bars. Annuli with an insufficient number of detected pixels are indicated as open blue circles and were excluded from the determination of best-fit curves (red).
Current usage metrics show cumulative count of Article Views (full-text article views including HTML views, PDF and ePub downloads, according to the available data) and Abstracts Views on Vision4Press platform.
Data correspond to usage on the plateform after 2015. The current usage metrics is available 48-96 hours after online publication and is updated daily on week days.
Initial download of the metrics may take a while.