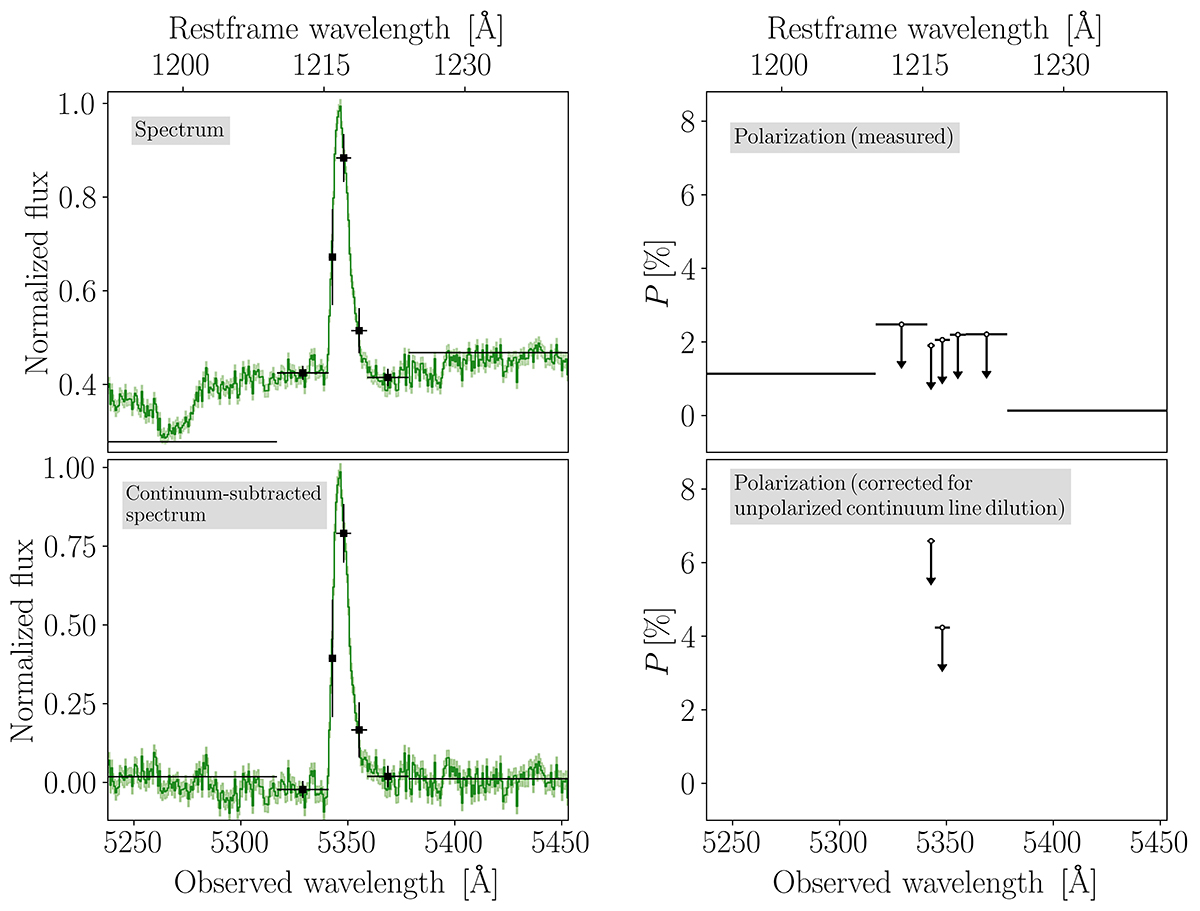
Fig. A.1.
Download original image
Left panels: Total intensity spectra (green solid line) and 1σ uncertainties (light green shaded region) in the spectral region around the Lyα line, similar to those presented in Fig. 2, but in the three-bin case. The top (bottom) panel shows the normalized spectrum before (after) the subtraction of the BCG contribution. The black filled squares, with 1σ uncertainties, represent the binned data. Right panels: Polarization (P) measurements obtained before (top) and after (bottom) the dilution correction described in Eq. 1. The black open circles represent the 1σ upper limits obtained by applying the correction of Simmons & Stewart (1985). In the bottom right panel, only two datapoints are visible, as the others are outside the plotted range (upper limits for P from 13 to 95%).
Current usage metrics show cumulative count of Article Views (full-text article views including HTML views, PDF and ePub downloads, according to the available data) and Abstracts Views on Vision4Press platform.
Data correspond to usage on the plateform after 2015. The current usage metrics is available 48-96 hours after online publication and is updated daily on week days.
Initial download of the metrics may take a while.